Reversal CFDs Candle Patterns - Inverted Hammer CFD Candlestick Pattern
Inverted Hammer Bullish CFDs Candles Patterns
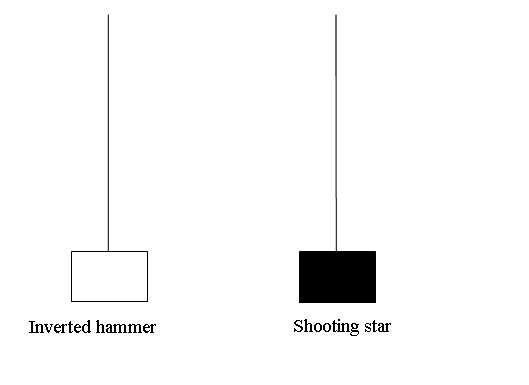
Inverted Hammer CFDs Candles Pattern & Shooting Star CFD Candlesticks Pattern candlesticks look alike. These have a long upper shadow and a short body at the bottom. Their color does not matter. What matters is the point where they appear whether at the top of a cfd market cfd trend (star) or the bottom of a cfd market cfd trend (hammer).
The difference is that inverted hammer candle-sticks pattern is a bullish reversal candle pattern while shooting star candlesticks pattern is a bearish reversal candle pattern.
Upward CFD Trend Reversal - Shooting Star Candles Pattern
Downward CFD Trend Reversal - Inverted Hammer Candles pattern
Inverted Hammer CFDs Candles Pattern & Shooting Star CFD Candle Pattern CFDs Chart Patterns
Inverted Hammer CFDs Candlesticks Pattern
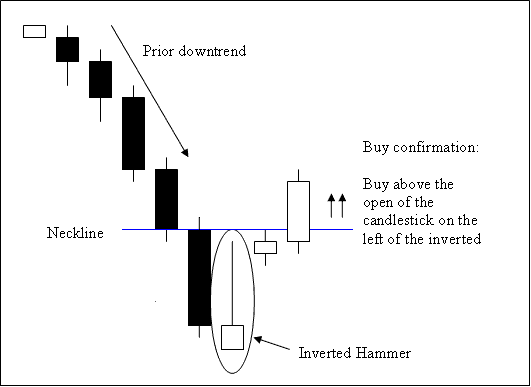
Inverted Hammer CFDs Candle Pattern is a bullish reversal candles pattern. It occurs at the bottom of a CFD trend.
Inverted hammer candlesticks pattern occurs at the bottom of a cfd down trend & indicates the possibility of reversal of the downward CFD trend.
Inverted Hammer CFDs Candlesticks Patterns Explained - How to Trade Inverted Hammer CFD Candle Pattern Technical Analysis Explained" Analyze Inverted Hammer CFD Candles Pattern
Analysis of Inverted Hammer CFDs Candle Pattern
A buy is confirmed when a candlestick closes above the neckline of the inverted hammer candlestick pattern, this is the opening cfds price of the candlestick on the left side of this inverted hammer candlestick pattern. The neck line level in this acts as a resistance level.
Stop loss orders for the buy cfds trades should be set few pips below lowest cfds price on the recent low of this inverted hammer candlesticks pattern.
An inverted hammer is named so because it indicates that the cfd market is hammering out a bottom.