Is Head and Shoulders CFD Pattern Bullish or Bearish?
Head & Shoulders CFDs Chart Pattern
Head and Shoulders CFDs Chart Pattern is a Bearish CFDs Pattern - Head and Shoulders Pattern is a Bearish CFD Signal Pattern
Summary:
- This Head & Shoulders CFDs Pattern forms after an extended move upward - cfd upwards trend
- This Head & Shoulders CFDs Chart Pattern formation indicates that there will be a reversal in the cfds market
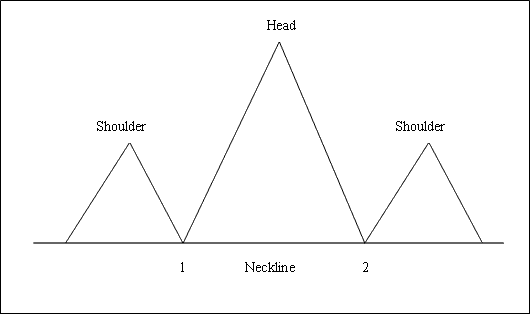
- This Head & Shoulders CFDs Pattern formation looks like a head with shoulders thus its name.
- To draw the neckline we use chart point 1 and point 2 as illustrated on the cfd example shown below. We also extend this line in both directions.
- We sell when cfds price breaks-out below the neckline: as described on the cfd example shown below.
What Does Head & Shoulders CFDs Pattern Mean?
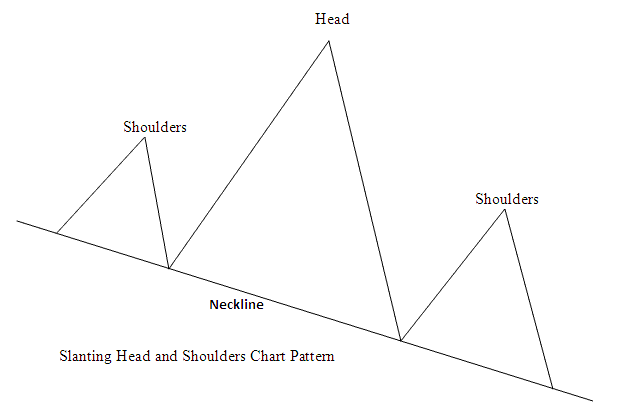
Or the head & shoulders cfd pattern can also form on a slanting neckline, like the cfd example shown below:
What Does Head & Shoulders CFDs Pattern Mean?
Examples of Head & Shoulders CFD Pattern on a CFD Chart
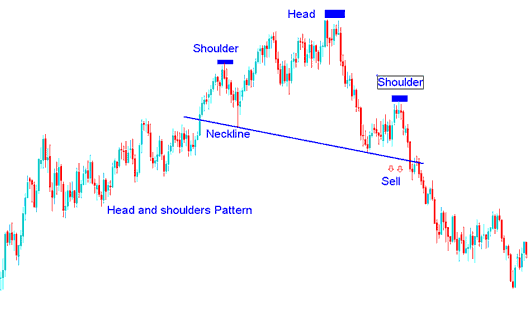
Technical Analysis of Head and Shoulders CFDs Pattern - Example of Head and Shoulders CFDs Chart Pattern
This Head & Shoulders CFDs Pattern can also be formed on a slanting neckline, like the head & shoulders cfd pattern example above, the neckline doesn't have to be necessarily horizontal.