RVI Forex Trading Technical Analysis & Relative Vigor Index Signals
Developed by John Ehlers
The Relative Vigor Index combines the older concepts of technical analysis with modern digital signal processing theories and filters to create a practical & useful indicator.
The basic principle behind it is simple -
- Prices tend to close higher than they open in up-trending markets and
- Prices close lower than they open in down-trending markets.
The momentum (vigor) of the move will therefore established by where the prices end up at the close of the candle. Relative Vigor Index plots 2 lines the RVI Line and the signal Line.
The RVI index is essentially based on measuring of the average difference between the closing & opening price, and this value is then averaged to the mean daily trading range and then plotted.
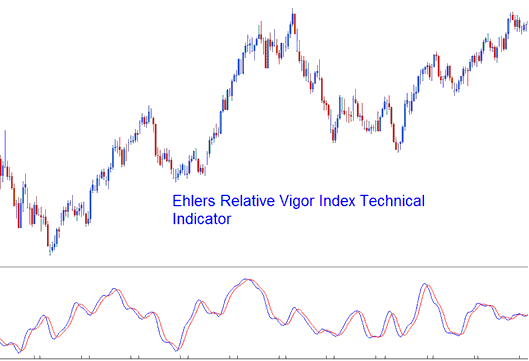
This makes the index a responsive oscillator that has quick turning points which are in phase with the market cycles of prices.
Forex Trading Technical Analysis & How to Generate Signals
The Relative Vigor Index is an oscillator. Basic method of analyzing the index is to use the crossovers of the RVI & the SignalLine. Trading Signals are generated when there is a cross-over of the 2 lines.
Bullish Signals - a buy signal occurs when the RVI crosses above the SignalLine.
Bearish Signals - a sell signal occurs when the RVI crosses below the SignalLine.
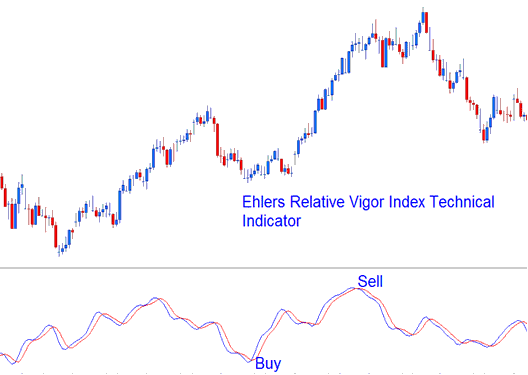
Buy & sell signals generated using the cross over technique