RSI Indicator Divergence Setups - Bullish Divergence RSI and Bearish Divergence RSI
Forex Divergence is one of the trade setups used by Forex traders. It involves looking at a forex chart & one more technical indicator. For our example we shall use the RSI indicator.
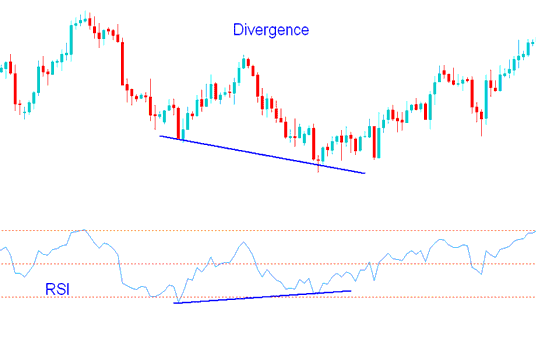
To spot this forex divergence setup find 2 chart points at which price makes a new swing high or a new swing low but the RSI indicator does not, indicating a divergence between price & momentum.
RSI Forex Divergence Example:
In the forex chart below we identify two chart points, point A and point B (swing highs)
Then using RSI technical indicator we check the highs made by the forex RSI technical indicator, these are the highs that are directly below the forex Chart points A & B.
We then draw one line on the forex chart & another line on the RSI indicator.
RSI Divergence Trading Setup - Forex Divergence Trading using RSI Indicator - Bullish Divergence RSI and Bearish Divergence RSI
How to spot forex divergence
In order to spot this forex divergence trading setup we look for the following:
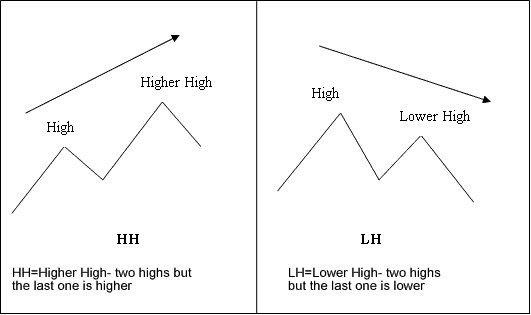
HH = Higher High - two highs but the last one is higher
LH = Lower High - two highs but the last one is lower
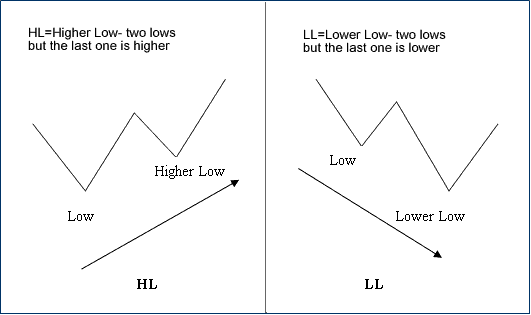
HL = Higher Low - two lows but the last one is higher
LL = Lower Low - two lows but the last one is lower
First let us look at the illustrations of these forex trading terms
Divergence Trading Terms - RSI Bullish Divergence vs RSI Bearish Divergence
Forex Divergence Trading Terms Definition Examples - Bullish Divergence and Bearish Divergence RSI
There are two types of forex divergence trading setups:
- Classic Forex Trading Divergence
- Hidden FX Trading Divergence