What should I look for in a Forex Chart?
The most popular forex chart types are:
- Line Charts
- Bar Charts
- Candlesticks Charts
The best chart to trade with when you want to start forex trading is the candlesticks chart. The candlesticks charts are easy to use and easier to interpret when trading. Beginner traders should start with this type of chart which is easier to use when it comes to technical analysis of forex charts.
Candlesticks - these use the same price data as bar charts (open, high, low, & close). However, they in a much more visually identifiable way which resembles a candle with wicks on both its ends.
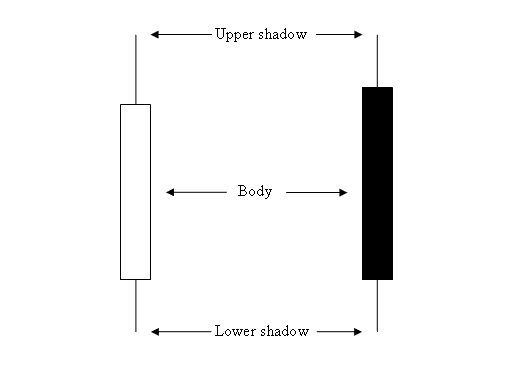
How to Analyze Candles Charts in Forex Trading
Rectangle section is called the body.
The high and low are described as shadows & plotted as poking lines.
Candlesticks Charts - What should I look for in a Forex Chart?
The color of the candle is either blue or red
- (Blue or Green Color) - Prices moved up
- (Red Color) - Prices moved down
Most trading platforms like the MT4 Forex Platform, use colors to mark the direction of the candlesticks. Colors used are blue or green: when price moves up - green candlesticks, when price moves down - red candles.