Bollinger Band XAUUSD Indicator and Price Volatility
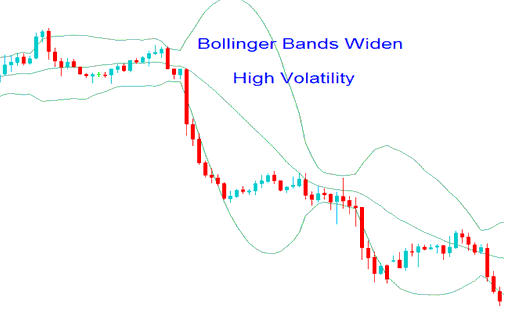
When price volatility is high, prices move significantly away from the moving average, causing Bollinger Band width to expand and accommodate larger price movements that remain within 95% of the mean.
Bollinger Band indicator will widen as price volatility widens. This will show as the bollinger bands bulge around the price. When the bollinger bands widen like this it's a continuation pattern & price will continue going in this direction. This is usually a continuation signal.
The visual representation of the Bollinger Bands indicator, explained and shown below, demonstrates the Bollinger Band expansion phase.

High Price Volatility - Bollinger Band XAUUSD Indicator - Bollinger Band Bulge
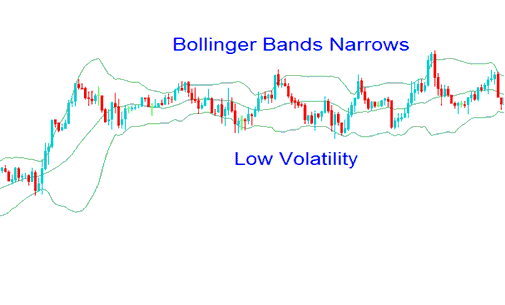
When price movement lacks strength (low volatility), the closing prices remain nearer to the moving average, and the band width contracts, thus constraining the potential price swing contained within 95% of the average.
When market volatility decreases, prices typically consolidate while awaiting a breakout. During periods when the Bollinger Bands indicator moves sideways, it is advisable to avoid entering new trades and remain on the sidelines.
The Bollinger bands indicator examples is shown below when the bollinger bands narrowed.

Reduced Price Volatility Indicated by Bollinger Band for XAUUSD - Recognizing the Bollinger Band Squeeze
Get More Courses & Guides:
- How to Add Moving Average XAUUSD Indicator in Trading Chart in MetaTrader 4 Software
- Basic Methods for Trading XAUUSD
- How do you trade the ascending triangle pattern in gold?
- Placing a New XAU USD Order on the MetaTrader 5 iPhone Trading Application
- How do you add stop loss orders for XAU/USD in MetaTrader 4 charts?
- Awesome Oscillator: Buy and Sell Signal Strategies
- Best swing indicators for MT4 – a quick list.
- Learning What a Gold Chart Is and How to Understand Gold Using a Gold Chart
- How Do You Trade the Difference between Gold Stop Entry Gold Order and Stop Loss XAU USD Order?
- Top Bollinger Bands for 5-Min XAU USD Charts

