DeMarker Gold Trading Analysis and DeMarker Trading Signals
Developed by Tom Demark.
This gold indicator is designed to overcome the general shortcomings of traditional overbought & oversold technical indicators.
The DeMarker is used by Gold traders to predict potential market bottoms and tops by utilizing xauusd price data comparisons from one bar to the next.
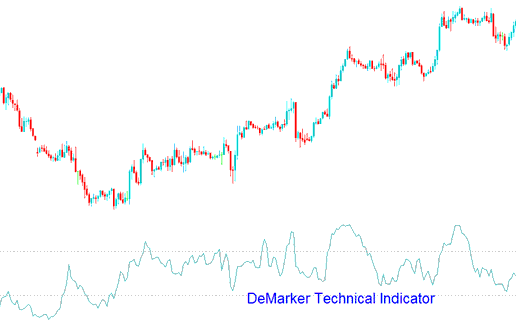
XAUUSD Trading Analysis & How to Generate Trading Signals
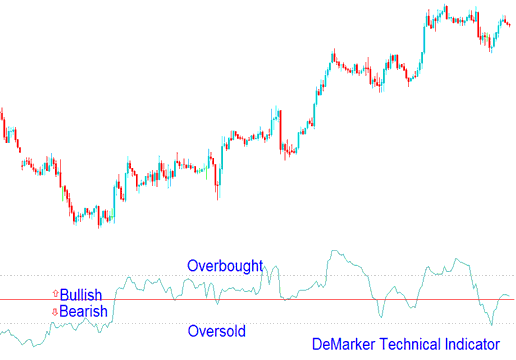
This gold indicator is interpreted in the same way as other overbought / oversold indicators. The overbought level is marked at 70 while oversold is marked at 30.
Bullish Reversal Trading Signal - When the DeMarker falls below 30, the bullish xauusd price reversal should be expected.
Bearish Reversal Trading Signal - When the DeMarker rises above 70, the bearish xauusd price reversal should be expected.
Technical Analysis in XAUUSD Trading
If you use longer time frames to draw the Demarker, you will get to catch the long term market trends. If you use the short time frame based on shorter periods you can enter the xauusd market at the point where the risk is minimum and you can plan the time of transaction so that it is within the major Gold trend.


