How Do I Analyze XAUUSD Charts using Trend Lines?
How to Interpret Gold Charts using a XAUUSD Trend
To analyze gold charts using trends gold traders will have to first identify a xauusd trend.
How Do you identify a xauusd trend on a gold chart - to identify a xauusd trend on a gold chart gold traders will need to learn the correct way of determining a gold trend - a gold trend is a general xauusd price direction in the xauusd price movement where xauusd price movement is either up or down.
When the gold trend is moving upwards it means that xauusd price movement is moving higher & xauusd prices are closing higher than where they opened and therefore the general xauusd price trend direction of xauusd prices is upward.
When the gold trend is heading downwards it means that xauusd price movement is moving lower & xauusd prices are closing lower than where they opened and therefore the general xauusd price trend direction of xauusd price movement is downward.
To identify a gold trends on xauusd charts gold traders will use a series of xauusd price highs or xauusd price lows.
Traders will then draw a gold trendline connecting xauusd price highs or xauusd price lows & this gold trendline will then determine the direction of the trend whether upward or downward.
Upward Gold Trend
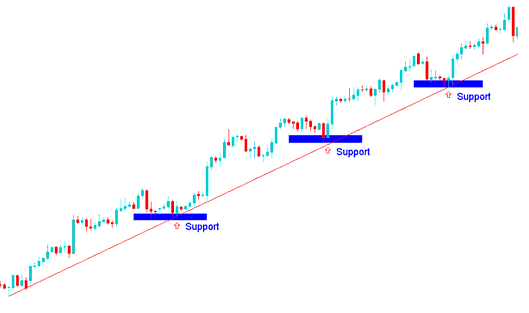
To identify an upward trendline on xauusd charts - traders will identify xauusd price lows which are sloping upwards & then use these xauusd price lows to draw a gold trendline - upwards gold trendline to connect these xauusd price lows & once this upwards trendline is drawn on the gold chart it will then be used to identify the upwards trend.
How Do You Analyze XAUUSD Charts using Trend Lines? - How Do I Analyze Gold Charts using Trend Line?
When the xauusd price moves upwards it forms higher highs & higher lows forming an upwards movement of xauusd price. An upward gold trendline can then be plotted by connecting these xauusd price higher lows.
To draw this upward trendline - we use support levels. To draw the upward trendline correctly two support levels on xauusd price chart are needed.
How Do I Interpret XAUUSD Charts using Trendlines?
XAUUSD Downwards Trend
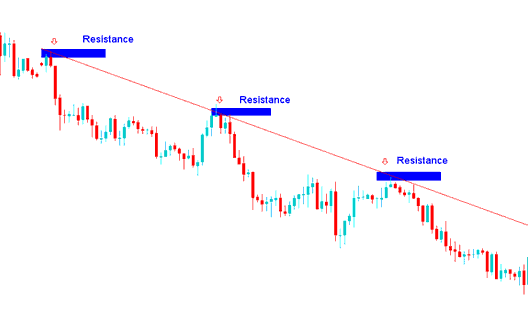
To identify a gold downward trend line - traders will identify xauusd price highs that are sloping downwards & then use these xauusd price highs to draw a gold trend-line - downward gold trendline to connect these xauusd price highs & once this downwards trendline is drawn on a gold chart it will then be used to identify the xauusd trading downwards trend.
How Do You Analyze XAUUSD Charts using Trend Lines?
When it comes to learning how to draw gold trendlines and determining gold trends on xauusd charts, you need to know that when price movement are moving they form lower lows & lower highs forming a downward xauusd price direction. These are points which are then used to draw the downwards gold trendline.
To determine a gold downward trend - we use resistance zones to draw a downwards gold trendline & to determine a downward gold trend correctly two resistance levels on the xauusd trading chart are needed.
How Do I Interpret XAUUSD Charts using Trendlines?
Once gold traders draw and determine a gold trend using gold trend lines - traders will then open xauusd trades in the direction of this xauusd trend. This is because once xauusd price movement begin to move in a gold trend direction either upward or downward - the xauusd price movement will continue to keep moving in this direction for some time.
How Do I Interpret Gold Trends?


