Piercing Line Candle Pattern
Piercing Line Bullish XAUUSD Candlestick Patterns
The dark cloud cover candle-stick pattern and the piercing line candle-stick pattern are very similar, but the former occurs at the peak of an upward trend (cloud cover), whereas the latter occurs at the bottom of a downward trend (piercing).
Upwards Trend Reversal - Dark Cloud Cover Candles
Downwards Trend Reversal - Piercing Line Candlesticks
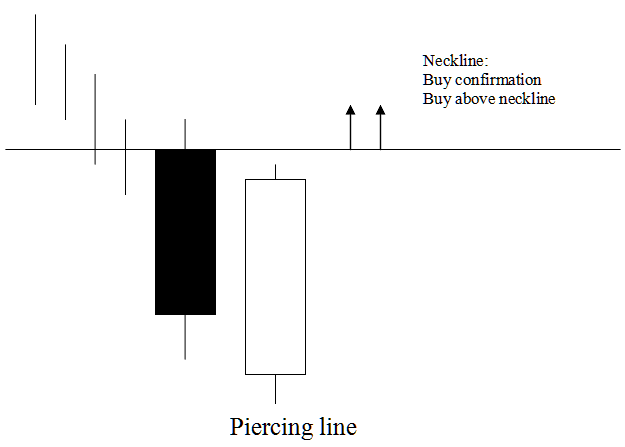
Piercing Line Candle
Piercing line is a long black body followed by long white body candle.
The white body pierces the midpoint of previous black body.
This represents a bullish reversal setup that forms at the bottom of a downward XAU/USD gold trend, indicating that the market opens at a lower price and closes above the mid-point of the previous black candle.
This shows that the force of the down-trend is reducing/decreasing and the price trend is likely to reverse & move in an upwards direction.
This pattern is called a piercing line, which means the market is breaking through the bottom, showing where the price might stop going down.

Piercing Line Candle
Analysis Piercing Line Candlestick
When the xauusd price closes above the neck line, which is the start of the candlestick on the left of the Piercing Line candlestick, a buy trading signal is confirmed.
This scenario suggests a bullish outlook, meaning the XAUUSD price is expected to continue its upward movement: consequently, a trader entering a buy position should simultaneously set a stop loss order just beneath the lowest recorded XAUUSD price point.
Dark Cloud Cover Candlestick
Opposite of piercing candlestick.
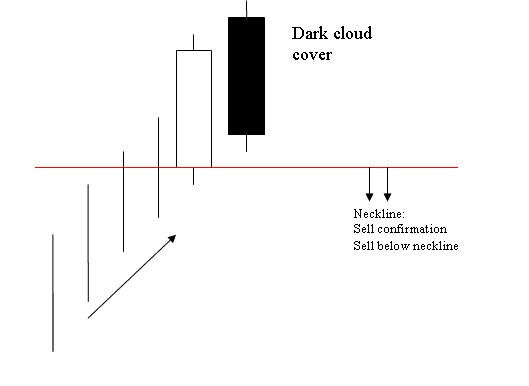
This candlestick is a long white body followed by a long black body.
Black body pierces the midpoint of the prior white body.
Bearish Reversal Pattern Appears at the End of XAUUSD Uptrends.
It shows the market opens higher and closes below the mid-point of the white body.
This means the upward trend is losing strength, and the price trend will likely change and start moving in a downward direction.
This particular configuration is recognized as a cloud cover, indicating that the cloud mass is acting as an overhead resistance ceiling for upward price movement.

Dark Cloud Cover Candle
Analysis Dark Cloud Cover Candlestick
A sell signal gets confirmed once xauusd price closes below neckline which is the opening of the candle on the left of this candlestick.
This configuration suggests a bearish trajectory, implying that the XAUUSD price should continue declining: a trader holding a sell position should place a stop loss order just above the peak XAUUSD price level reached.
More Topics:
- Gold Charts: Divergence Trade Setup Uncovered
- Making a XAU USD Trading Strategy Using a Gold Plan
- Tech Study of Relative Vigor Index Trade Indicator Buy Forex Signal
- Using a Fake MetaTrader 4 Account to Practice Trading Gold
- Developing a Systematic Approach for Generating Buy and Sell Signals for XAU/USD Trades
- Signing into an MT4 Demo Trading Account: Instructions Simplified
- What are some trading strategies for the 5-minute XAUUSD chart?
- How to Utilize Pivot Points in Trading Indicators
- Calculator for margins on MT4
- What Is Bullish Gold Divergence Trading?

