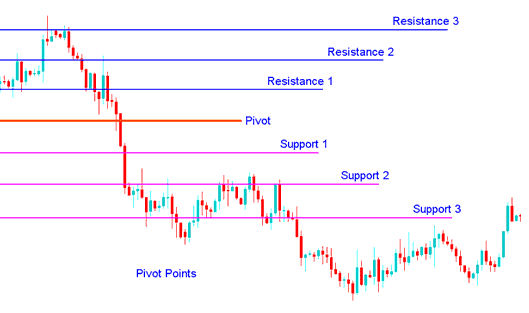
Pivot Support Resistance Indicator MT4 Indicator
Pivot Support Resistance Technical Indicator MetaTrader 4 is a set of indicators used to determine potential turning points or potential gold breakout points, also known as 'pivots' or pivot point. These Pivot Support Resistance Areas are calculated to determine points which the gold trend could change from a 'bullish' to "bearish market trend or from a 'bearish' to "bullish trend." traders use the Pivot Support Resistance Zones as zones of support & resistance.
These calculated Support and Resistance levels, derived from Pivot Points, are determined by averaging the session's high, low, and closing prices from the preceding trading period.
XAU/USD Pivot Point = (High + Low + Close) / 3
XAUUSD day traders leverage the calculated support and resistance zones derived from pivot points to ascertain optimal levels for initiating trades, setting stop-loss placements, and designating profit-taking targets, by attempting to anticipate where the bulk of other gold traders might be positioning themselves.
A pivot point is a technical gold analysis price level utilized by Gold traders as a leading or predictive indicator for price direction. The Pivot Support Resistance Indicator is calculated by averaging the key prices (high, low, and close) from the preceding market period. If prices during the subsequent trading period remain above this central pivot, it signals a bullish trend: conversely, trading below the central pivot is interpreted as bearish.
The center pivot point is used to calculate the additional levels of support resistance, below and above the center pivot point - by either subtracting or adding the price differentials calculated from the previous day trading ranges.
A calculated pivot point, along with the surrounding pivot support and resistance zones, frequently acts as a reversal point for price trajectory shifts.
- In an upwards trend, the pivot point indicator and the pivot resistance levels - represent a ceiling level for price - if price goes above this level the up-ward trend is no longer sustainable & a gold trend reversal is likely to occur.
- In a down-wards gold trend, the pivot-point and the pivot support areas may represent a low for the price level or a resistance to further the price decline.
Center pivot can then be used to calculate the support/resistance zones as follows:
The Pivot Support Resistance Technical Indicator on MetaTrader 4 comprises one central pivot point level flanked by three support levels situated below it and three resistance zones situated above it. Pivot Support Resistance Levels offer traders a rapid means to gauge the expected market movement throughout the trading session, derived from a few straightforward mathematical calculations based on the preceding closing price (useful for Previous Day Close Break Out Strategy & Market Open Strategies).
The Pivot Support Resistance indicator on MetaTrader 4 leads rather than lags. You just need the prior day's high, low, and close to figure the zones for today. This tool uses a 24-hour cycle. It calculates support and resistance with these steps:
Center pivot can then be used to calculate the support/resistance zones as follows:
Resistance 3
Resistance 2
Resistance 1
Pivot Point
Support 1
Support 2
Support 3

Indicator for Potential Breakouts – Description of the Pivot Support and Resistance Technical Indicator for MetaTrader 4.
More Guides & Topics:
- How to Use the Chande QStick Indicator for Trading
- Gold Price Movement: Applying the 1-2-3 XAUUSD Price Action Strategy in Gold Trading
- Procedures for Activating an Automated Trading Bot (EA) within the MetaTrader 5 Software
- Gold Methods That Work
- Techniques for Predicting XAU/USD Trend Reversals and Identifying Corresponding Signals
- Meaning of Margin Calls in XAU/USD Trading
- What are the Different Types of XAU USD Reversal Patterns Different Types?
- Setting up the Ehler MESA Adaptive Moving Average for XAU/USD in MetaTrader 4
- Using Fibonacci Expansion lines in a Fibonacci Expansion Plan.
- Finding Gold Support and Resistance Levels

