Recursive Moving Trend Average Analysis & Trading Signals
This Indicator is calculated using a mathematical polynomial fit, the formula is referred to as Recursive Moving Polynomial Fit.
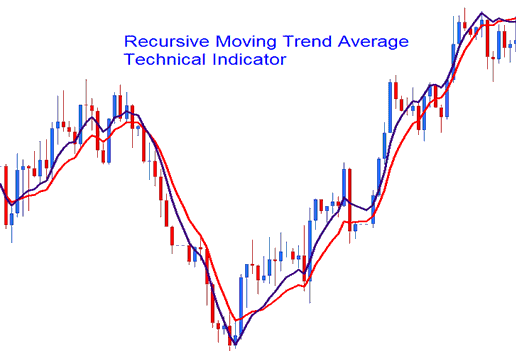
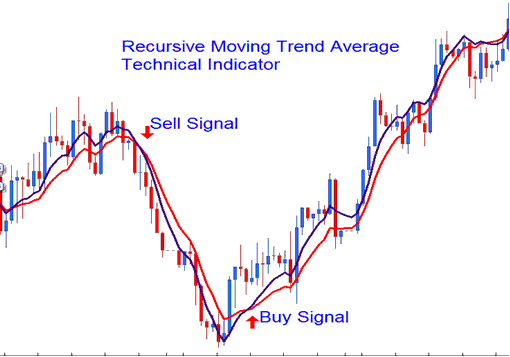
This formula needed to calculate this trading indicator uses just a little bit of past data to figure out and predict the next price movement. The example shown below demonstrates how two Recursive Averages work together to create a crossover system method.

Analysis and Generating Signals
The best way to analyze charts is the crossover strategy, where you combine two moving averages, like the 14 and 21. When they cross each other going up, it's a signal to buy: when they cross going down, it's a signal to sell.

Buy Sell Trading Signal
Recursive Averages closely resemble traditional moving averages (MA) but are smoother due to their calculation method. This makes them less susceptible to false signals like fake outs and whipsaws.
Review Further Programs and Subject Areas:
- How to Study XAU USD with a Practice XAU USD Demo Account
- Head and Shoulders & Reverse/Inverse Head and Shoulders XAUUSD Patterns
- List of Best Technical XAU USD Indicators for Gold
- MT4 XAU/USD Platform Software Tutorial Course User Tutorial
- Types of Oscillator Gold Indicator Technical
- Analysis of Gold Charts Using the MA (Moving Average) Indicator
- Double Bottoms XAUUSD Pattern on Bollinger Bands Indicator Trend Reversals
- How Can I Login in to MT4 XAU/USD Account?
- MT4 Gold Platform Lesson for XAU/USD Beginners Simplified Guide
- How to Set Parabolic SAR XAUUSD Indicator in Chart in MT4 Platform Software

