Stochastic Oscillator Bullish Gold Divergence and Bearish Divergence Gold Trading
Divergence gold trading is one of the gold trading signals that can be generated when using the stochastic oscillator xauusd technical indicator.
Divergence gold trading is a signal that a rally or retracement is losing steam and is likely to reverse. It means that the last buyers or last sellers are pushing the xauusd price in one way while the majority of other gold traders have stopped trading in that direction and are cautious of a xauusd price correction or retracement.
There are four types of xauusd divergence trading setups
Example 1: Classic XAUUSD Bullish Divergence
A Gold Trading Classic Bullish Divergence in the stochastic oscillator indicator and the xauusd price is followed by a rise in xauusd price.
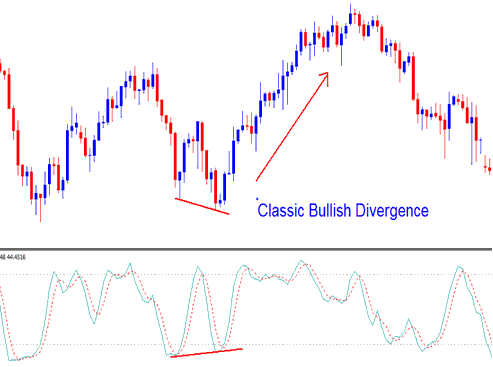
Stochastic Oscillator Gold Indicator Classic Gold Bullish Divergence
When the xauusd price is making new lows the Stochastic indicator is not moving past its previous lows it is an indication that the downward gold trend is about to reverse and a bullish gold trading rally is likely to occur.
In the xauusd trading example above the xauusd price set a new low but it was not coupled with a new low in the measure of Stochastic oscillator gold indicator, when price formed a new low then the stochastic gold indicator should have followed suit, but the stochastic indicator did not therefore the gold trading classic divergence trading setup.
XAUUSD classic divergence trading setup is even stronger because there is combination of a divergence gold trade setup and then followed by a rise above the 20% indicator level. This combines the Over-bought and Oversold levels with this xauusd divergence trading setup.
Example 2: Classic XAUUSD Bearish Divergence
A Classic Gold Bearish Divergence trading setup in the stochastic oscillator xauusd technical indicator and the xauusd price is followed by a drop in xauusd price.
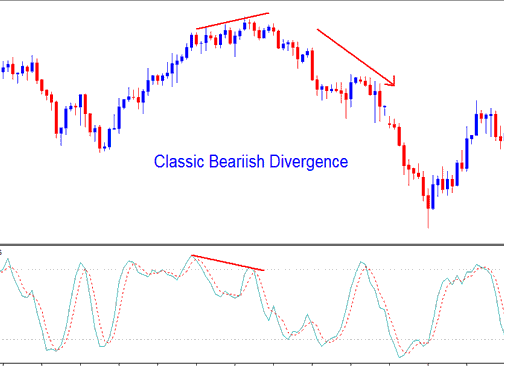
Stochastic Oscillator Gold Indicator Classic Gold Bearish Divergence
When xauusd price is making new highs but the Stochastic oscillator gold indicator is not moving beyond its previous high it is an indication the upward trend will reverse and that a gold trading bearish divergence trade set-up will follow.
This classic gold trading bearish divergence trade setup is even stronger because there is a combination of a xauusd divergence with a dip below the overbought 80 level.
Example 3: Hidden XAUUSD Bullish Divergence
Hidden Gold Bullish Divergence trade setup signifies a retracement in an upward xauusd trend. This gold trading hidden divergence trading setup is the best type of xauusd trading divergence setup to trade, because you are not trading a xauusd price reversal, but you are trading within the direction of the Gold trend.
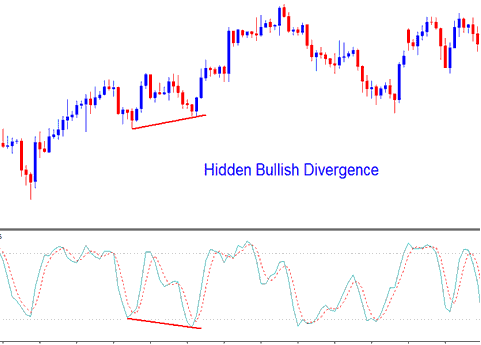
Stochastic Oscillator Gold Indicator Hidden Gold Bullish Divergence
Even though, the stochastic oscillator gold indicator made a lower low the xauusd price low was higher than the previous low (higher low). This means that even though the gold sellers made a good attempt to push xauusd price down as indicated by the stochastic indicator, this was not reflected on the xauusd price, and the xauusd price did not make a new low. This is the best place to open a buy gold trade, since it is even in an upward gold trend there is no need to wait for a confirmation gold trading signal, because you are buying in an upward Gold trend.
Example 4: Hidden XAUUSD Bearish Divergence
Hidden Gold Bearish Divergence trading setup signifies a retracement in a downwards trend.
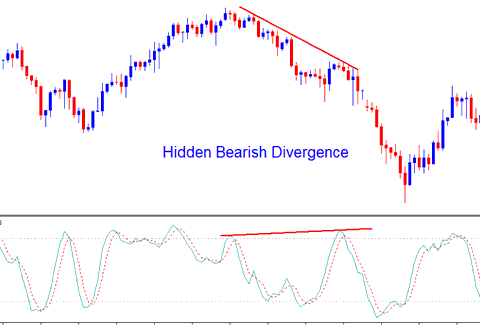
Stochastic Oscillator Gold Indicator Hidden Gold Bearish Divergence
Hidden gold trading bearish divergence xauusd trading setup is the best type of divergence to trade, because you are not trading a xauusd price trend reversal, but you are trading within the direction of the trend. This is the best place to open a sell gold trade, since it is even in a downward trend there is no need to wait for a confirmation gold trading signal, because you are selling in a downward Gold trend.


