Analysis Rainbow Charts Indicator Sell Signal & Buy Signal
Rainbow Charts How to Read Indicator Buy Signal
Analysis Buy Signal Using Rainbow Charts Indicator
Steps on how to study buy signals using Rainbow Charts indicator:
This Rainbow Charts indicator buy signal tutorial explains in detail how to read buy signals using the Rainbow Charts indicator as is shown in the example below:
Buy Signal
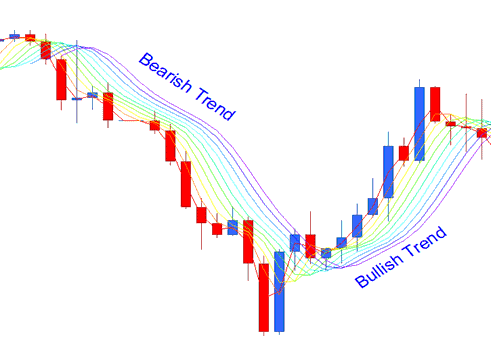
In an uptrend, the Rainbow Charts indicator rises. The red line, least smoothed, sits at the top. The violet line, most smoothed, stays at the bottom.
Analysis Rainbow Charts Trading Indicator?
Rainbow Charts How to Read Indicator Sell Signal
Analysis Sell Signal Using Rainbow Charts Indicator
Steps on how to study sell signals using Rainbow Charts indicator:
This Rainbow Charts indicator sell signal guide explains in detail how to read and study sell trading signals using the Rainbow Charts indicator like as shown in the example below:
Sell Signal
When trend is a bearish downward trend then the Rainbow Charts indicator will be moving downwards - the major smoothed line (Violet) will be at the bottom of the Rainbow Charts indicator and the least smoothed line (Red) will be at the top of the Rainbow Charts indicator.
Analysis Rainbow Charts Trading Indicator?
Analysis Rainbow Charts Indicator?
Learn More Lessons & Courses:
- Aroon Gold Indicator Technical Analysis on Gold Charts
- Making Gold Crossovers A Stochastic Gold Tool to Buy and Sell XAU/USD
- Trading with the Acceleration/Deceleration (AC) Indicator Effectively
- Practical Application of Fibonacci Retracement Levels within MT5 Software
- What XAU USD patterns are useful for Gold Day Trading strategies?

