True Strength Index Gold Analysis & TSI Trading Signals
True Trend Indicator
Conceived and Constructed by William Blau
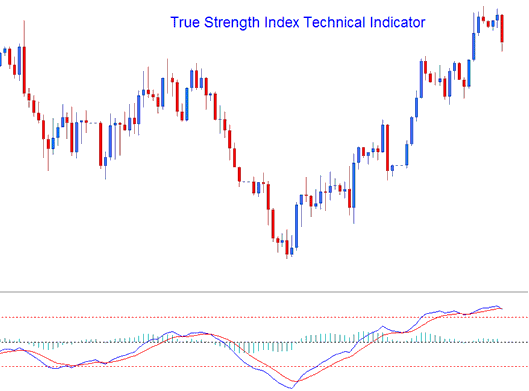
The TSI functions as an indicator of momentum. The TSI is constructed using a momentum calculation that reacts more swiftly and sensitively to price fluctuations, positioning it as a leading indicator that tracks the direction of trading price action in the market closely.
TSI is drawn as a blue line, the technical indicator also plots a signal-line which is drawn as a red line, and these two lines are used to generate cross over signals.
TSI also draws a histogram which shows the difference between the TSI Line & the Signal-line. This histogram crosses above the or below the center-line, histogram levels above the center-line indicates a bullish cross-over signal, while center-line levels below the center-line indicates a bearish cross over signal.

Analysis and Generating Signals
The TSI utilizes various techniques to generate trading signals, functioning similarly to the RSI in determining the overall trend direction of the markets. It also highlights overbought and oversold levels. The most common methods for generating signals include:
Zero Line Histogram Crossover (Excludes Line Crossover) Techniques for XAUUSD Trading
- Buy - when the histogram crosses above 0 a buy signal gets generated
- Sell - when the histogram crosses below the 0 a sell gets generated

Gold Signal line Trading Crossover
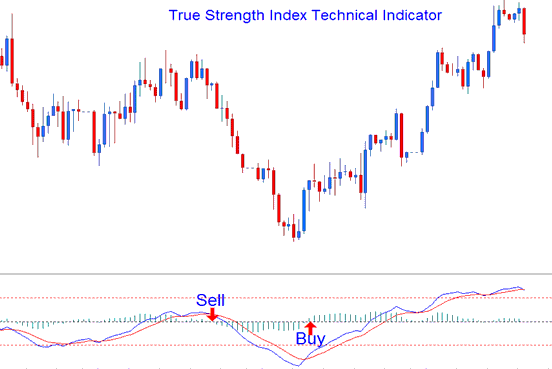
- A buy gets generated when the TSI line crosses above the Signal-line
- A sell signal gets derived & generated when the TSI line crosses below the Signal-line
This type of trade signal aligns with histogram crossovers, marking significant points for potential action.
Divergence Trade
Divergence setups are utilized to spot potential trend reversal points. Examples of reversal divergence setups include:
Classic Divergence
Gold Trade Classic Bullish Divergence: Lower lows in price & higher lows on the technical indicator
Classic Bearish Divergence in gold trading: It occurs when price reaches higher highs while the technical indicator records lower highs.
Trading based on divergence can also be used to find potential points where a price action trend may continue. The continuation divergences are:
Hidden Divergence Trading Setup
Gold Hidden Bullish Divergence: higher lows in price & lower lows on the technical indicator
Gold Trading Signal: Detecting Hidden Bearish Divergence Noted by Lower Peaks in Price Combined with Higher Peaks on the Indicator.
Over-bought/Oversold Levels on Indicator
This can be used to spot when prices have risen or fallen too much in the market's price changes.
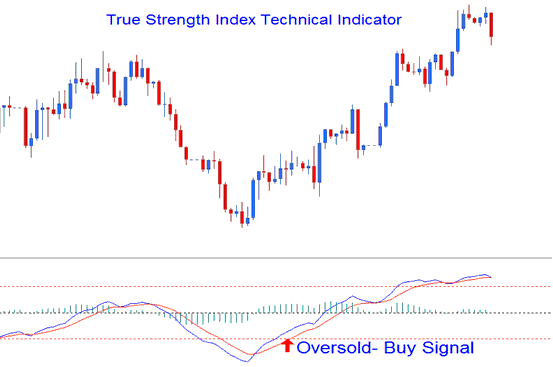
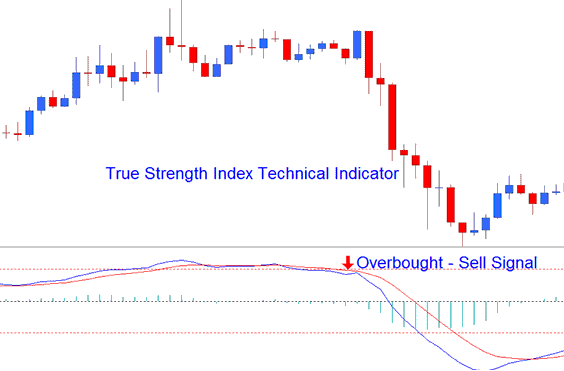
- Overbought condition - levels being higher than the +25 level
- Over-sold condition - levels being lesser than the -25 level
When TSI crosses these technical levels, trades may be created or obtained.
Buy signal happens when levels cross above -25. That creates the signal.
Sell trading signal - when the levels cross below +25 level a sell gets generated.

Oversold - Buy Trade Signal

Overbought - Sell Trading Signal
The overbought/oversold levels are marked by horizontal lines at +25 and -25 levels.
Explore More Tutorials and Courses
- Types of Technical Trend Indicators
- How Do I Trade Support Resistance Levels in an Upwards XAUUSD Trend?
- Ten Gold Funds Management Trading Methods
- How to Do XAU/USD Practice & Learn Trade the XAU USD Market Using Gold Demo Account
- Moving Average Envelopes XAUUSD Indicator
- Characteristics of the 3 Major Gold Sessions
