Trading XAUUSD interpret Gold Charts
Analyzing XAUUSD Charts
There are Three types of charts used in Gold: Line Charts, Bar Charts & Candlesticks Charts.
Line Charts - draws continuous line connecting closing xauusd prices of gold.
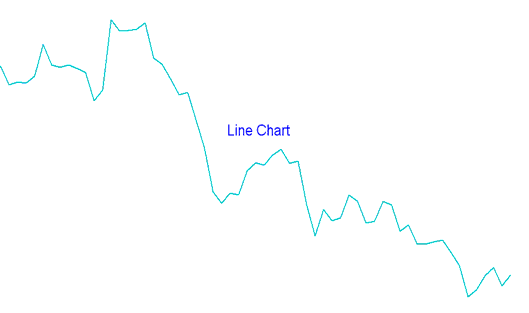
Gold Trading Line Charts - What are the 3 Types of Gold Charts?
Bar Charts- displayed as sequence of OHCL bars. O-H-C-L represents OPEN HIGH LOW & CLOSE. The Opening xauusd price is displayed as a horizontal dash on the left & closing xauusd price as a horizontal dash on the right.
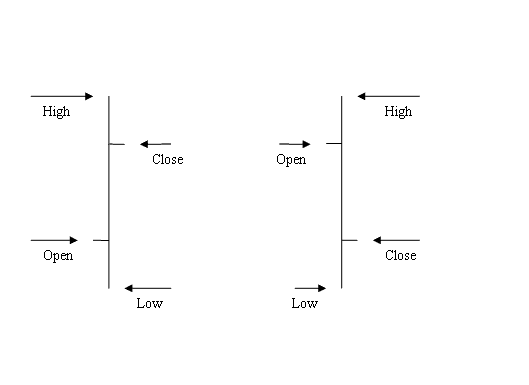
Gold Bar Charts - What are the 3 Types of Gold Charts?
Candle Stick Charts - these trading charts use same price data as bar charts (open, high, low, and close). However, they are represented in a much more visually identifiable way which looks like a candlestick with 2 wicks on both ends.
How to Interpret
The rectangle part is called the body.
The high and low are described as shadows & drawn as poking lines.
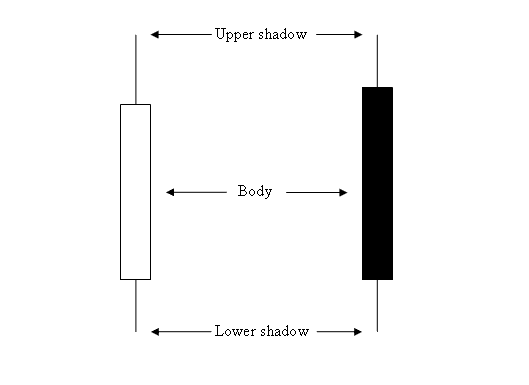
Gold Candlesticks Charts - What are the 3 Types of Gold Charts?
The color of the candlestick is either blue or red
- (Blue or Green Color) - Gold Prices moved up
- (Red Color) - Gold Prices moved down
Most gold trading platforms like the MT4, use colors to mark the direction. Colors used are blue or green: when price moves up, red: when price moves down.
