
Consolidation Patterns in XAU/USD Trading
In bilateral or consolidation patterns, price can go either way. Gold charts form two main types of these patterns.
- Symmetric/Symmetrical Triangles - Consolidation Patterns
- Rectangles - Range/ranging market
Symmetrical Triangles - Consolidation Patterns
Symmetric triangles are commonly referred to as consolidation patterns.
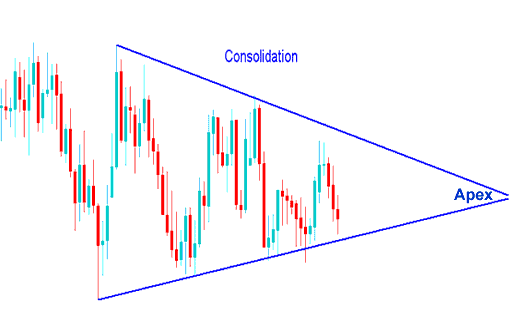
Symmetrical triangles represent chart formations characterized by converging trend lines marking a period of price consolidation. The buy entry point derived from a symmetrical triangle occurs on an upward breakout, whereas a downward break generates a sell signal. Ideally, the market should exit the triangle via a breakout prior to the convergence point (apex) being reached.
Gold Price Trendlines can be constructed by connecting the troughs and peaks observed during a consolidation phase: the resulting trendlines are symmetrical and converge toward an apex point. A breakout is typically anticipated to occur somewhere between 60% and 80% into the formation of the triangle pattern. Breakouts occurring too early or too late are statistically more prone to fail and are therefore considered less dependable. Following a price breakout from the apex, the apex area subsequently establishes support and resistance zones for the market price. The price that has successfully exited the apex should not subsequently retreat past this apex point. This apex is often utilized as the defined area for placing stop-loss orders for open XAU/USD trades.
These consolidation chart patterns occur when the market is unable to decide which direction to move due to a tug of war between buyers and sellers, and we say the Gold market is pausing before making a decision about the next trend direction.
Consolidation Pattern
But this setup won't last forever. Think of tug-of-war: one side pulls ahead at last. Look at the price chart below. The range broke out and headed one way. So how do we join the winners?
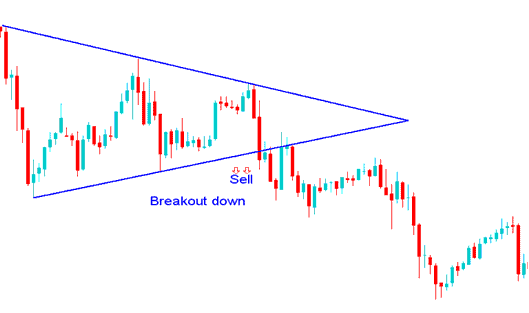
Price Stays Steady – Price Falls Down: Trading Suggestion to Sell following a Period of Price Staying Steady
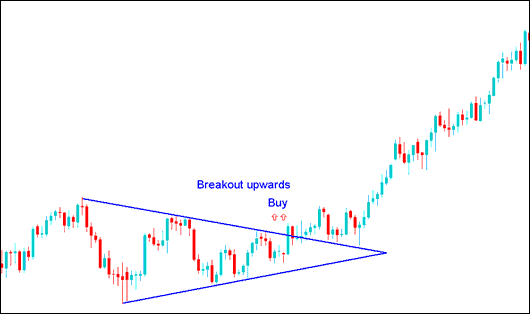
Sideways Price Movement Pattern - Upward Breakout Indication - A Buy Trading Signal Following a Period of Consolidation
So, going back to our question, how can we be sure we're winning? We wait for the XAUUSD price to go past one of the lines and then place buy or sell orders in that direction. If the price breaks the upper line after staying in the same area, we buy: if it breaks the lower line, we sell.
Alternatively, if you prefer not to wait for consolidation, pending orders can be utilized. For further information on pending orders, refer to the guide: Stop Entry Order Types.
The 2 types of stop order types used to trade consolidation chart patterns are:
Buy Entry Stop: An instruction to open a buying position at a price that exceeds the current market trading price.
Sell Entry Stop: An instruction to enter a sell trade at a level positioned beneath the present market price.
These are orders to open buy trade above the market or to open sell trade below the market.
Rectangle Pattern
In the gold price market, a rectangle consolidation pattern is a trading range with little price movement that creates a consolidation phase. Two parallel trend lines that are horizontal and represent support and resistance establish the trading range. The rectangle pattern gets its name from the rectangle used to represent it on a chart.
For the formation of this type of consolidation chart pattern, market prices establish several peaks and valleys that are connected by parallel horizontal lines. This process unfolds over an extended timeframe, resulting in the pattern configuration taking on a rectangular shape.
A breakout happens when price crosses one of the horizontal lines in this pattern. It ends the rectangle's range. An upward break means buy. A downward one means sell.
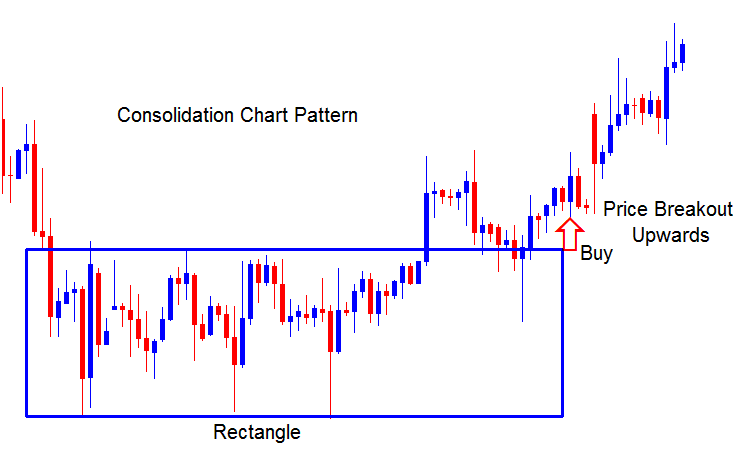
Rectangle Chart Pattern
The price of gold breaks out of its tight range after some time and keeps increasing following a market breakout upward.
Get More Lessons & Courses:
- Comparison of Executing XAUUSD Buy Long Trades Versus XAU USD Sell Short Trades
- Instructions for Placing and Setting a Sell Stop Order Using MetaTrader 4 Trade Software
- How Do You Interpret a New Gold Order on XAU/USD MT4 iPhone Trading App?
- How Do You Interpret Fib Extension Settings on MT4 Platform/Software?
- Top XAUUSD Analysis Tool: MetaTrader 4 Platform
- Varieties of Gold Traders
- Using the Gator Oscillator indicator for XAU/USD.
- Strategies for day trading XAUUSD using pivot points and reversal signals in gold.
- Principles of How Can You Draw Gold Trendlines?