
Drawing Upwards Trend Lines and Channels
An upward trendline on the XAUUSD chart is drawn when prices are generally trending upwards. This line is placed below the rising prices by connecting at least two low points during the uptrend. It acts as a visual representation of the market's overall upward trajectory.
This trading concept is demonstrated by the example picture shown below, which also illustrates how prices fluctuate during an uptrend. As the market rises, it continues to establish new support zones that are utilized to create the upward trend line.
Because the market heads in a zigzag kind of manner, traders will normally draw a trend which shows the general upward trending direction.
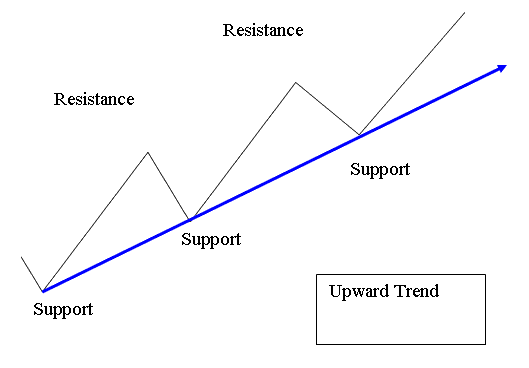
Upwards Trending Market
An upward trend manifests as the price of Gold consistently establishes consecutive peaks that are higher than the previous ones (higher highs) and troughs that are also higher than the preceding ones (higher lows).
The Upward trend lines gain more validity each time the price of Gold touches the line but doesn't penetrate it. An uptrend remains in play until this series of higher highs and higher lows is broken.
A break below an uptrend line signals a sell. It often means the uptrend ends or starts to flatten.
Drawing an upward Trend Line
When the online gold market rises, it creates higher highs and higher lows, indicating a bullish price movement. An upward trendline can then be drawn by connecting the higher lows.
We utilize price-created support levels to depict this configuration. In order to correctly draw an upward trend line, two support levels are necessary. When prices test or touch this upward trendline, we buy and put a stop loss just a few pips below it. The example of an increasing trendline is shown in the diagram below.
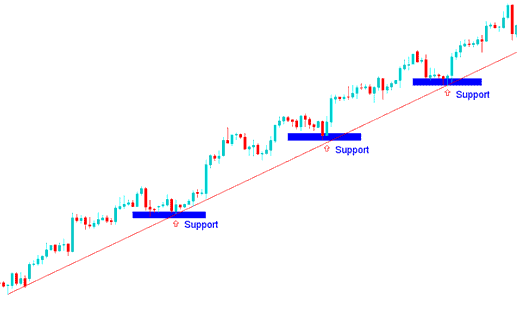
Upwards Trend-Line - Gold Trading
The trend line pattern signals a rising direction for the Gold market. Traders focus on buy orders if price stays in this pattern and near support lines. These lines hold firm when price pulls back. Buyers wait for price to drop to those spots before entering buy trades.
Trades initiated at these levels exhibit a very high risk-to-reward ratio and tend to be quite profitable.
In the arrangement described above, the trader would have initiated buy/long trades based on signals generated at support1, support2, and support3, resulting in significant profitability with minimal draw-down or retracement. This advantageous outcome is why this particular trend-line trading structure is favored by numerous traders.
Drawing Upward Channel
An upward channel is constructed by plotting a line that runs parallel to the existing upward trend line, subsequently adjusting this new line until it contacts the upper boundary of the market price movement. This action establishes a channel for the price, and so long as the price remains confined between these two lines, the bullish price action for XAUUSD is projected to persist upward.
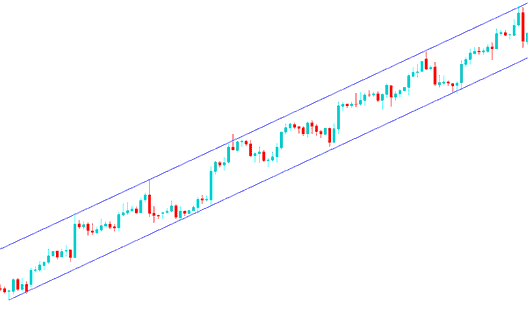
Upwards Channel - XAUUSD Trading
Trading the Upward XAUUSD Prices Channel
This upwards channel is used by Gold traders to show levels where it best to take profit orders. Gold traders will take some profit once the price touches upper channel and wait for another price retracement before opening another buy trade position again.
MT4 Tools for Drawing Upward Trend Line & Channels
The instruments necessary for plotting and sketching these trade setups within the MT4 platform are housed in the MT4 drawing tool bar inside the MetaTrader 4 software. If this tool bar isn't currently active on your platform, activate it by selecting "View" next to "File" in the top-left corner of MT4, then clicking "View," subsequently selecting "Tool Bars," and finally checking the "Lines Tool Bar."
Below is the screen shot of the MT4 trend lines drawing tool bar. To draw a trend-line on a trading chart just click on this tool & select the point where you want to draw.
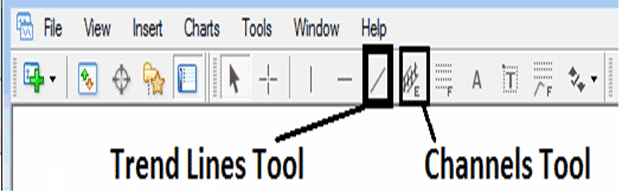
MT4 Tool-Bar for Drawing Upward Trendline and Channels
More Guides and Courses:
- How to Create a Trading Plan?
- Following the Gold Bull Pennant Chart Pattern: Next Steps
- Technical Analysis: Buy Trading Signal Identified by the Kase Peak Oscillator Indicator
- Guide of How to Hide Quotes on the MT4 XAUUSD Trade Software
- Excel Calculator for XAU/USD Stop Loss
- How to Use MT4 to Trade Gold on an iPhone
- Clarification on What Constitutes the Margin Level Within MT5 Software
- How Can I Add XAUUSD Volumes Trading Indicator on XAU/USD Chart?
- What Are the Steps to Study a Direction Using a Trendline?
- Selecting the Right Analysis XAU/USD Strategy for Beginner Traders