Fib Drawing on XAUUSD Charts Exercises
These exercises will give more examples on trading and drawing Fibonacci retracements and Fibonacci expansion levels. The first exercise is to figure out the direction of the XAUUSD price trend & then determine if the Fib tool used is Fibonacci retracement or Fibonacci expansion and then figure how it's drawn then practice drawing them on a Gold trading chart using a practice demo trade account.
Tasks:
Figure out the direction of the XAUUSD price trend
Determine if the Fibonacci is retracement or extension
Figure how it's drawn
Practice drawing retracement or expansion on a XAUUSD Gold price chart.
To find Gold trading charts just download MT4 Gold platform from any one of the many online brokers and select the financial instrument - Gold.
After you have downloaded the MT4 platform software, Go to the menu "insert" at the left top corner, on the drop down menu, click Fibonacci and choose either the option of retracement or extension. Then draw it as presented in the previous lessons of Fibonacci Expansion & Fib Retracement. Then do the following exercises:
Fib Retracement Levels & Fibonacci Expansion Levels Exercise
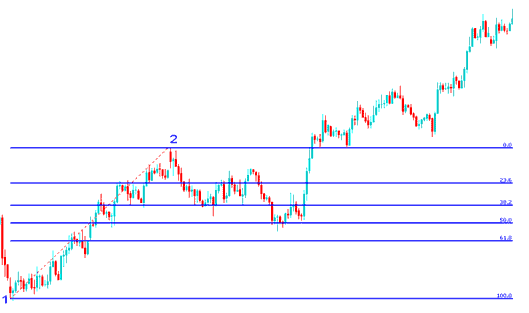
Exercises 1:
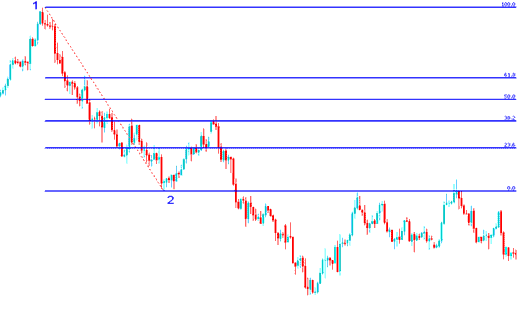
Training Exercises 2:
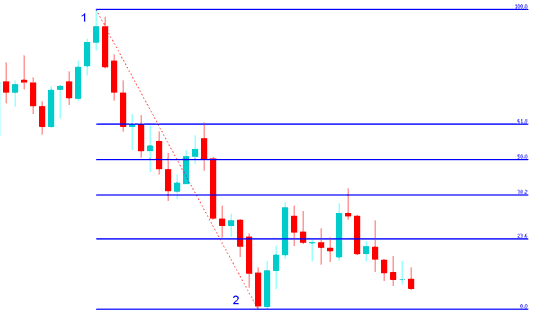
Exercises 3:
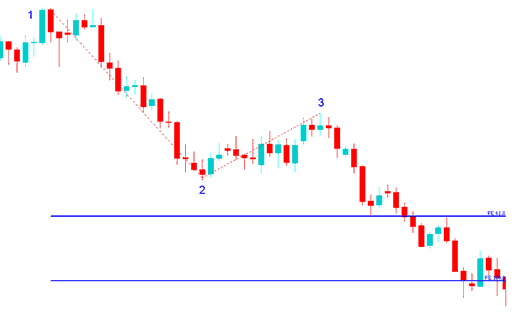
Training Exercises 4:
Hint: point 1 to point 2 follows the trend direction
Hint: Retracement has points 1 and 2
Hint: Extension has point 1, 2 & 3
More Topics and Courses:
- Combining Together Stochastic Trading Indicator with Other XAUUSD Indicators
- What XAU/USD Patterns Should I Trade with in XAU/USD Day Trading?
- Technical Analysis Darvas Box Trading Indicator Buy Trading Signal
- 5 Min XAU/USD Chart Strategies
- How to Add Market Facilitation Index Trade Indicator on XAU/USD Chart
