How to Draw Trend-Lines & Channels on XAUUSD Trading Charts
Support and resistance levels can sometimes form diagonally, mimicking a staircase. This creates a price trend characterized by a consistent upward or downward movement.
You can show this trend with a line on the chart.
A trend line depicts points of support & resistance for price, depending on the direction of the prices. For an upwards moving market a trend line will show the points of support and for a downward market the trend-line will show areas of resistance. Trend lines are mainly used by investors to identify these points of support & resistance.
A straight line joining two or more price points and then continuing into the future to serve as a degree of support or resistance is called a trendline. There are two kinds of trend-lines: one that goes up and one that goes down. Trend line is a feature of technical analysis that tries to forecast where the following market move is most likely to go by means of line studies.
A trader wanting to trade Gold metal online using analysis must know how to draw and interpret the trading signals derived/generated by this trend-line trading tool.
Trend line study is based on the idea that market prices of Gold move in trends. The trend-lines show 3 things about the current trend, including:
- The overall direction of the market price - whether up or down
- The strength of the current move
- Where future support & resistance levels will likely be located
If a trend line forms in a certain direction, then the market mostly moves in that particular direction for quite some time until the moment when this trend is broken. When the trend is broken the trend-line will also be broken - meaning price will move below an upwards trend-line or above a downward trend-line.
Trend lines on gold charts reveal the main XAUUSD price direction, up or down.
The exemplification presented below show how to draw trend-lines:
Upward Trendline
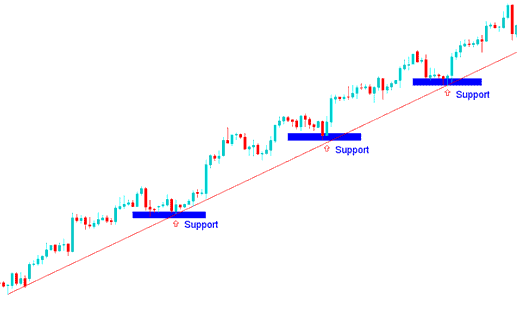
Upward Trend-Line - Upwards Trend of Gold Prices
Downward Trendline
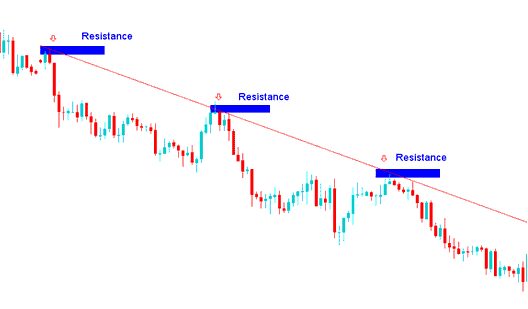
Downward Trend-Line - Downwards Trend of Gold Prices
The Process of Charting Trend Lines for XAUUSD Trading on the MetaTrader 4 Application
The MT4 XAUUSD platform offers charting and drawing tools for trend lines on gold charts. Gold traders can use these tools, as shown below, to draw trend lines.
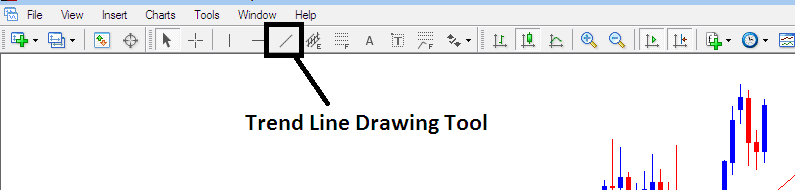
MT4 Platform Trend Line Drawing Tool
To plot trend-lines on a XAUUSD chart just click the line drawing tool shown above on the MetaTrader 4 analysis software & choose point A where you want to start drawing the line and then point B where you want the it to touch. You can also rightclick on the trend-line and after rightclicking on it, on "properties" option choose the option/choice to extend its ray by ticking the "ray check box", if you do not want to extend it, then uncheck/untick this option on your MT4 platform. You also can change other properties such as colour and width of the trend-line on this property settings pop-up window.
"Go with what's happening" is something people often say to investors because you shouldn't fight what's popular. Watching the trend is the best way to trade gold prices because when prices start going one way, they can stay going that way for quite some time, so using this method gives you the highest chance of earning money from trading gold online.
Principles of How to Draw TrendLines
- Use candle charts to draw trend-lines
- The points used to draw the trend lines are along the lows of the price bars in an upwards trend market. An upward bullish moving trend is defined by higher highs & higher lows.
- The points used to draw are along the highs of the price bars in a downward trend market. A downwards bullish move is defined by lower highs & lower lows.
- The points used to plot trend-lines are extremes points - the high or low price. These extreme points are important because a close beyond the extreme tells investors & traders that the market trend of the Gold metal prices might be changing. This is interpreted as an entry or an exit trading signal.
- The more times a trend line is hit but not broken, the more powerful its signal is.
There are 2 main methods of trading this set-up:
- The Bounce
- Break
Technical Analysis of These Two Methods. The trend-line bounce signals continuation. Price hits the line and keeps going the trend way. In an uptrend, price touches support and bounces higher.
In a downwards trend move, the market will bounce downwards after hitting and touching this technical level which is the resistance level.
A trend-line break is when things change direction as the market goes past the trend-line and starts moving the other way in the market.
Should an uptrend experience a breakdown, the prevailing market sentiment shifts, turning bearish. Conversely, when a downtrend is breached, the market sentiment undergoes a reversal to become bullish.
For very strong trends, after this trend-line break signal, the price will consolidate for a while before going in the opposite trend direction. For short-term trends then this trend-line break signal will mean price might reverse immediately.
In gold trading, trend-line bounces and breaks serve as support and resistance levels. Both come from technical analysis on charts.
Utilizing Trendlines as Signals for Entering, Exiting, and Determining Stop Placements:
This trend-line trading method is used to identify good entry & points to exit opening & closing Gold trades, protective stop loss orders are placed just below or above these trendlines. The trend-line bounce is a low-risk entry method used by investors and traders to place entry trade transactions after price has retraced but the price is still within the trend direction. Trades are setup along these trend-line levels & a stop loss placed just above/below the trend-line.
When a trend line breaks, it is a key sign that the trend might change. When a trend line is broken, the price starts going in the opposite way. This lets investors and traders leave their trades early and take their profits. If the price goes past these trendline levels, it means the price might change direction and start a new trend.
Unlike other analysis indicators there is no formula used to calculate trend lines, this trend-line setup is just drawn between two chart points & a gold trader has to learn how to draw these trend-lines on their XAUUSD Gold metal charts.
Extra Lessons, Tutorials, and Courses to Learn:
- The Gator Oscillator Indicator for Use on the MT5 XAU USD Platform
- How Many Tops Draw a Downwards XAU USD Trend-line?
- Reiteration of strategies for the previous day's close breakout in XAU/USD.
- Recursive Moving Trend Average XAU USD Indicator
- Examples of Types of XAU USD Trend-lines used in XAU USD Trend Trade
- What Happens after a Gold Rising Wedge Setup?
- Step-by-Step: Adding Renko Chart Custom Indicators in MetaTrader 4 MetaEditor
- Beginner's Tutorial Guide for Learning XAU/USD Trading
- Why Host Your Expert Advisor XAU/USD EA Bots/Robots with VPS Provided by Your XAU/USD Broker Only
- How to Trade in MT4 Tutorial
