
Piercing Line Candle and Dark Cloud Candlestick
Piercing Line Candle and a Dark Cloud Candle both look similar but the difference is that one +occursforms at the top of a Gold price uptrend (Cloud Cover) and the other occurs at the bottom of a downward XAUUSD Gold price trend (Piercing Line).
Upward Reversal - Dark Cloud Cover Candles. Downward Reversal - Piercing Line Candles.
Piercing Line Candlestick
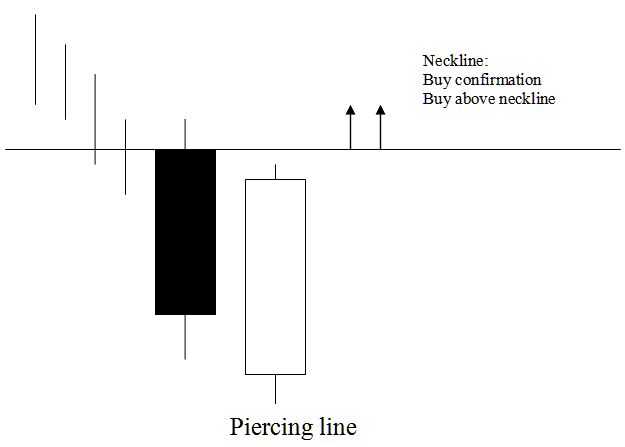
The piercing line candlestick pattern consists of a lengthily dark-bodied candle followed by a long white-bodied candle.
The white body pierces the mid point of the previous black body.
The piercing line candle configuration represents a bullish reversal pattern observed at the nadir of a market downturn. It is characterized by the price opening lower than the previous close and subsequently closing above the halfway point of the preceding candlestick's real body.
This pattern means the power of the drop is going down, and the market is likely to change direction and start heading upwards instead.
This piercing line candle pattern appears as a piercing line. It signals the market hits bottom and forms a floor for the XAUUSD gold price downtrend.
Piercing Line Chart Design
Technical Analysis of Piercing Line Candlestick
A piercing line candle pattern buy signal confirms when price closes above the neckline. That's the open of the candle left of the piercing line, as shown above.
This setup is bullish, so gold prices should keep climbing. If you're buying here, set your stop loss just below the recent low.
Dark Cloud Candlestick
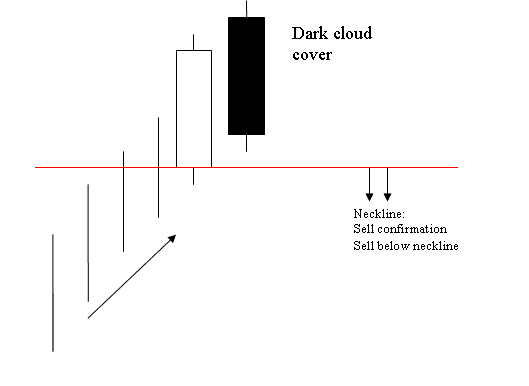
The Dark Cloud Cover candlestick pattern forms during an uptrend and is opposite to the Piercing Line pattern. It signals a potential trend reversal.
A dark cloud cover candle consists of a long white body followed by a long black body.
The black body cuts the middle of the prior white body.
The dark cloud cover candlestick is a bearish price reversal formation that materializes at the apex of an uptrend.
It shows that the market opens higher and closes below the midpoint of the white body.
Dark cloud cover candle pattern shows that the energy of the uptrend is decreasing and the trend is likely to reverse & move in a downward direction.
This candle pattern shows a cloud cover. It marks the cloud as a top barrier for rising XAUUSD gold prices.
Dark Cloud Candle Pattern
Technical Analysis of Dark Cloud Candlestick
A sell signal generated using this candle pattern formation is confirmed once price closes below the neckline which is the opening of the candle on the left of this candle like shown above.
This is a bearish setup & Gold price should continue moving downward and for a xauusd trader who puts a sell position they should place and put a stop loss just above the highest price level.
Examine More Courses & Topics:
- Adding Directional Arrows in XAU USD Charts on MT4 Program
- What are XAU/USD Chart Trade Patterns?
- Where to Determine When to Buy on a Gold Upward Trend
- How to Use TP XAU/USD Orders & Use Stop Loss Gold Order on MT4 Platform Software
- Finding the Top XAU USD Brokers and Gold Platforms for New Traders
- XAUUSD Instructions to Save Chart Style in MT5 Platform