Indicators for Setting Stop losses in XAU/USD Trading
Certain chart indicators are utilized to establish stop loss orders, obviating the need for Gold traders to make complicated computations about the optimum location for these stop loss orders.
A Gold trading systems trader also can set a stoploss order according to these chart trading technical indicators. Some indicators use mathematical calculations to calculate where the stoploss order should be placed so as to provide an optimal exit. These chart technical indicators can be used as the basis for setting stop losses when it comes to XAU/USD trading. These chart indicators follow price action of Gold price chart closely and define the boundaries which the Gold price should move along in. When the XAUUSD moves outside these boundaries it's thence best to close the open Gold trades as price stops heading in that particular direction.
Some of the Indicators that can be used to set stop losses are:
Parabolic SAR Indicator
The Parabolic SAR tool is useful for implementing a trailing stop loss when engaging in online trading of Gold.
Parabolic SAR technical indicator provides excellent exit points for setting stops.
- In an upwards trend, you should close long positions when price falls below the parabolic SAR
- In a downwards trend, you should close short positions when price rises above the parabolic SAR
In a long position, the market price sits above the parabolic SAR. The indicator rises each day, no matter the gold price direction. How much it rises depends on the XAUUSD price move.
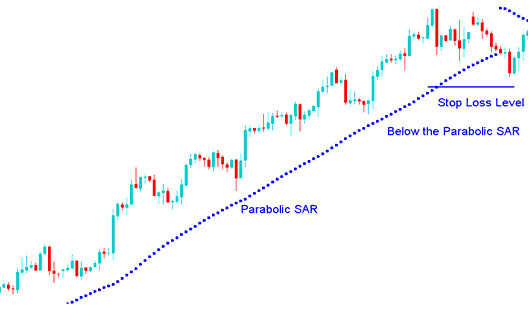
Parabolic SAR Indicator - Technical Chart Indicator
Parabolic SAR indicator & how it is used for setting stop loss orders
Bollinger Bands Indicator
The Bollinger Bands indicator uses standard deviation to guess how unstable the market is. Because standard deviation helps estimate market instability, the Bollinger bands change on their own, getting wider when the market is more unstable and smaller when it is more stable.
The Bollinger Bands indicator comprises three bands designed to encapsulate the majority of a trading instrument's price action. The middle band serves as a reference for the intermediate-term market trend, typically represented by a 20-period simple moving average, which also acts as the foundation for the upper and lower Bollinger Bands. The distance between the upper and lower bands from the middle band is influenced by the volatility of price movements. As these Bollinger Bands are employed to encompass the price action of the XAUUSD trading instrument, they can also be utilized to establish stop losses just beyond the boundaries of these bands.
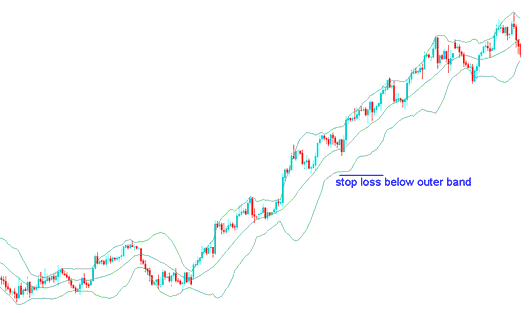
Setting the Stop Loss Level for Gold Prices Using the Bollinger Bands Indicator
Fib Retracement Levels Indicator
Furthermore, Fibonacci retracement levels serve to delineate zones of potential support and resistance: these identified areas are instrumental in determining appropriate stop-loss placement when trading Gold. The 61.8 percent level on the Fibonacci Retracement scale is overwhelmingly the most frequently utilized threshold for setting stop-loss orders. Ideally, a stop-loss mandate should be positioned just beneath the 61.80% Fibonacci retracement mark.
The 61.8 % Fib retracement level is used to set these stop loss order orders since this retracement level is rarely hit.
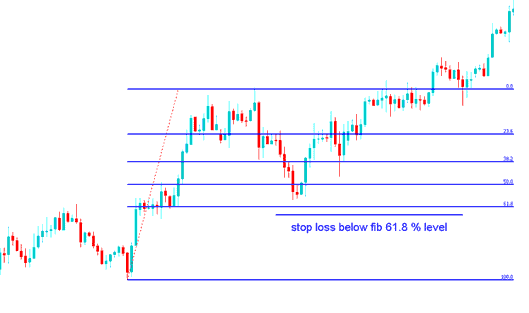
Fib Retracement Levels Chart Indicator Stop Loss Setting at 61.8 Percent Retracement Level
Fib retracement level 61.8% used to set stop orders in XAUUSD trading.
Support & Resistance Levels Lines
Support and resistance lines guide stop loss placement. Set stops just beyond these levels for safety.
Buy Trade - Stop loss set a few pips below the Support Level
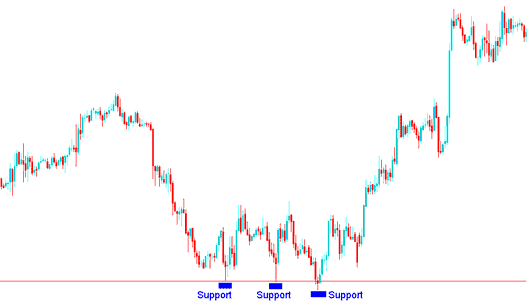
Buy Trade - Stop Loss Order order set a few pips just below the Support Zone
Sell Trade: Place Stop Loss Above Resistance
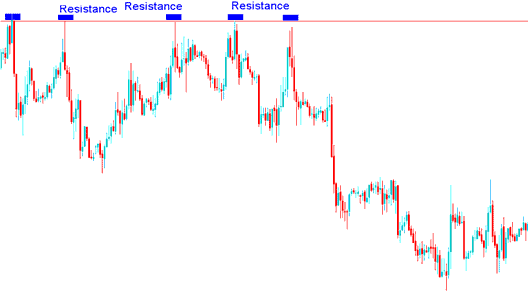
For a Sell Trade - set a Stop Loss Order a few pips above the Resistance Zone.
Get More Guides and Topics:
- How do you trade XAUUSD on the phone gold app?
- What's MT5 Gold Chart?
- Analyzing XAU/USD charts with gold trend analysis
- Reversal Candlestick Patterns: Bearish XAU/USD Trading Tutorial
- How Can You Trade 100.0% Fibonacci Extension Level?
- How do you trade trends in XAU/USD charts?
- How to Load a Gold Template on MT4 Software Platform
- Which XAUUSD Broker Works Best to Create a Cent Account?
- A System for XAU/USD That Makes XAUUSD Buy & Sell Signals
- Drawing Downward Trendlines for XAUUSD in the MT5 Platform
