Chart Patterns Trading Gold Patterns
Chart patterns are graphical representations of repeating price action formations which are commonly and often used in the analyzing the online Gold market.
Chart patterns are studied in technical analysis to help traders learn to spot chart setups that happen again and again.
These chart formations hold significant importance in Gold trading because when the market lacks a definitive directional bias, it is actively manifesting a pattern. Understanding these structural developments is vital for gaining insight into the potential forthcoming change in Gold's price behavior.
When the price action of gold is charted, numerous formations naturally arise and exhibit recurring behavior. These setups and patterns are frequently used by technical analysts to project the subsequent probable market direction.
Traders watch patterns and setups on charts. They reveal supply and demand at work. These drive XAUUSD gold price swings. Patterns fall into three main groups.
1. Foundational Reversal Patterns: Double Tops, Double Bottoms, Head and Shoulders, and Inverse Head and Shoulders patterns.
Continuation patterns include ascending versus descending triangles and bull flags/pennants versus bear flags/pennants.
3. Bilateral patternsSymmetric triangle - ConsolidationRectangle - Range-Bound Market
Reversal patterns are chart patterns that show when a market trend will change once the chart pattern is verified. These patterns happen after a price has been moving in one direction, up or down, for a while, and they indicate that the market might be ready to go the other way.
Continuation patterns - these continuation chart patterns are formations that setup the market for a continuation move in the direction of the prior trend. These continuation patterns are formed when the market is taking a pause before continuing in the same direction of the previous XAUUSD prices trend.
Consolidation patterns - these specific chart formations materialize when the market temporarily suspends activity before committing to its next directional move. When these patterns emerge, the market is effectively determining the trajectory for subsequent trading.
Technical Analysis of the Charts
There exist two distinct types of chart analysis in trading: while these two approaches may appear similar, they are indeed different.
The third menu option is Tile Horizontally Charts, which will arrange all currently open trading charts in a side-by-side horizontal layout, exactly as depicted and illustrated in the example following this text.
(This tutorial focuses specifically on the second alternative listed above, which pertains to chart formations.)
The different lessons for these 2 types of chart analysis are:
Japanese Candlesticks Patterns
- Marubozu and Doji Candlesticks Patterns
- Spinning Top Candlesticks Patterns
- Reversal Candlesticks Patterns
- Inverted Hammer and Shooting Star Candlesticks Patterns
- Piercing Line and Dark Cloud Candles Patterns
- Morning Star and Evening Star Candlesticks Patterns
Chart Patterns Tutorials
- Double Tops & Double Bottoms Chart Setups
- Continuation Patterns
- Consolidation Chart Patterns
- Head Shoulder & Reverse/Inverse Head Shoulders Patterns
Illustrated below are examples showcasing differences in setups and formations within two distinct trading analysis approaches.
Candlesticks - Study of a single candle
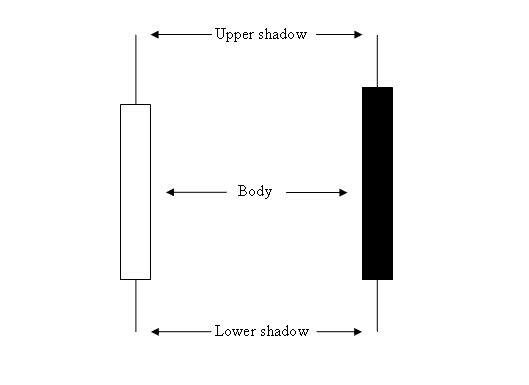
Candles
Formations - A methodical study of recurring sequences in candlestick arrangements.
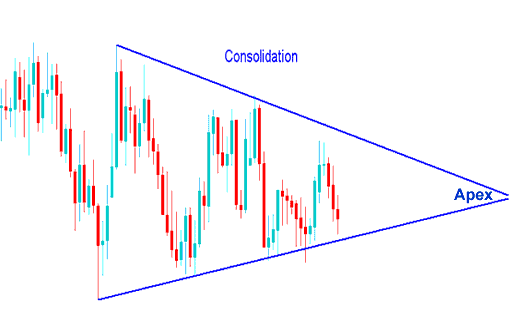
Consolidation Chart Pattern Setup - Trading Gold Using Patterns
Further Lessons, Tutorials, and Subjects:
- What's the Minimum Deposit Required to Open Cent XAU USD Account?
- How to Start XAU USD with Cent XAU USD Account
- How Do You Read Ehlers MESA Adaptive Moving Average MA Indicator Buy and Sell Forex Trading Signal?
- How Can I Calculate XAU USD Price Action?
- Counter-Trend Strategies for XAU/USD Trading
