Divergence Setups Trading XAUUSD Using Divergence Setup
Gold traders use divergence to study gold prices and try to guess which way the xauusd gold prices will move. It means checking the XAUUSD Gold price chart and one more indicator. We will use the MACD technical indicator.
To find divergence, look for two points where price hits a new high or low. MACD fails to match. This shows a gap between price and momentum.
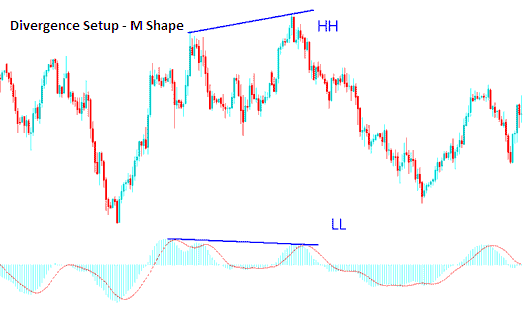
To search for divergence trading setups we look for 2 chart points, two highs that form an M-Shape on the XAUUSD Gold price chart or 2 lows which form a W-Shape on the Gold price chart. Then look for the same M-Shape or W Shape on the indicator which you use to trade.
Example of a XAUUSD Price Divergence Setup:
In the Gold chart below, we've marked two spots, point A and point B (high points). These two spots make an M-shape on the price chart.
With the MACD indicator, check its highs under chart points A and B.
We then draw one line on the Gold chart & another line on the MACD indicator just as shown below.
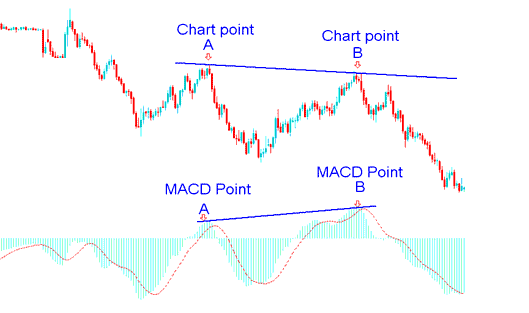
Gold - Divergence Setup - Drawing Divergence Lines
One of the four different forms of divergence trading setups is shown in the XAUSUD price chart above. This particular type, known as hidden bearish divergence, is one of the most popular to trade. In the following lesson on trading, we will go through various divergence trading setup patterns.
How to spot divergence Setup
In order to spot XAUUSD Gold divergence signal we check for the following:
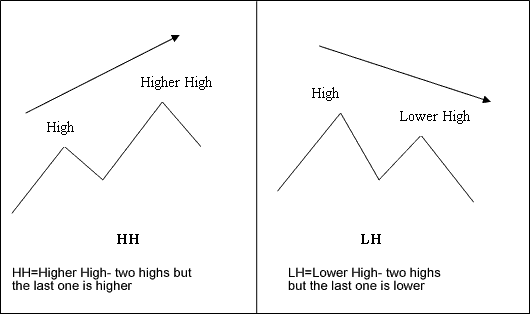
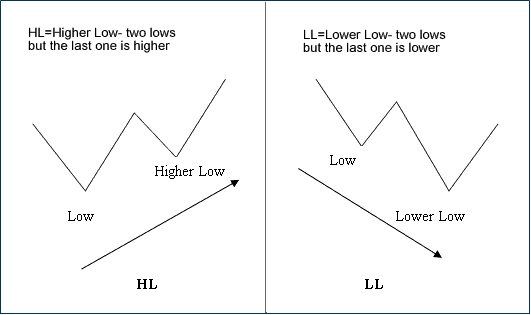
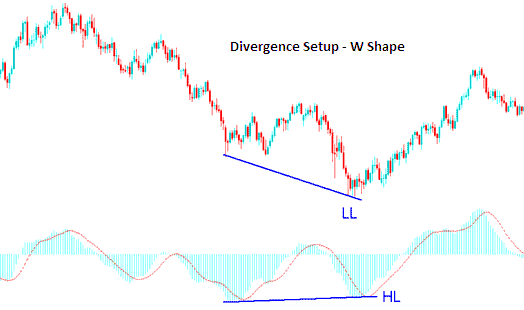
HH stands for Higher High (two peaks where the latter is taller): LH signifies Lower High (two peaks where the latter is shorter): HL denotes Higher Low (two troughs where the latter is higher): and LL means Lower Low (two troughs where the latter is lower).
First let's look at the explanations of these trading terms:
M-shapes dealing with price Highs
W-Shapes dealing with price lows
These concepts above are explained below using Gold price charts and MACD.
Example of M Shapes on XAUUSD Price Charts
Example of W Shapes on Gold Price Charts
Now that you as a trader have learned the divergence trading terms that are used to explain the divergence trading patterns. Let's look at the 2 types of divergence setups and how to trade these set-ups on XAUUSD price charts.
There 2 types are of divergence trading setups:
- Classic Divergence
- Hidden Divergence Setup
These 2 divergence trading setups are expounded on the next courses.
Learn more lessons and subjects:
- What does a Gold Morning Star Candlestick mean for XAUUSD?
- How to Open MT4 Gold Demo Practice Account
- Creating a Gold Strategy To Trade XAU USD with
- How to Trade XAU USD with a Gold Standard Account
- Chaikins Money Flow XAU USD Indicator Analysis
- How to Sign Up Live Trading Account XAUUSD
- Is Aroon Oscillator Leading or Lagging Technical Indicator
- Linear Regression Slope XAUUSD Indicator
- What Is the Way to Trade Using Gold Signals & Expert Advisor EAs?
- Tutorial on using the MetaTrader 4 platform for XAU/USD trading.
