Aroon Indicator Technical Analysis & Aroon Indicator Signals
Created and Developed by Tushar Chande
This stock indicator is used to determine if a financial instrument is trending or not.
It is also used to reflect how strong the market trend is.
It is also employed to detect and identify the inception of a market trend, hence its nomenclature implying morning or the start of a day.
This stock indicator has 2 lines:
- Aroon UP
- Aroon DOWN
Aroon UP
The percentage representing the time elapsed from the start of a defined period up to the maximum price level reached by the stock during that specific trading period.
If stock price sets a new high, Aroon UP will be 100 - for each new high it will stay at 100. However, if stock price moves down by a certain percentage, then that percentage is subtracted from the 100 & Aroon UP starts to move down. This means that if Aroon UP stays at 100 then price is making new highs but when it begins to move down then price isn't making new highs.
If however stock price is making new lows for a particular stock price period then Aroon UP will be at zero
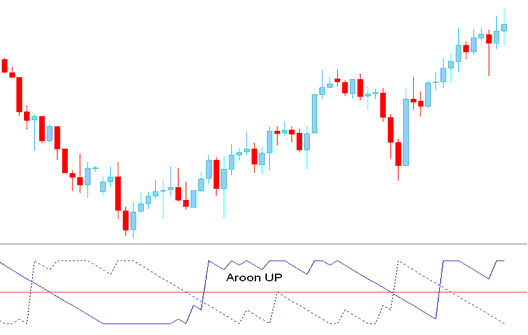
Calculation
Aroon UP is a percent of time between price period & highest point.
If you use Ten price periods for the calculation:
Example 1: Highest stock price was 1 day ago
Then if the highest point was yesterday, - 1 day before then
10 price periods minus 1 day= 9
9/10 in % terms = 90
Aroon UP will be at 90
Example 2: Highest stock price was 5 days ago
If the highest point was 5 days ago then
10 price periods minus 5 = 5
5/10 in % = 50
Aroon UP will be at 50
Aroon DOWN
This is calculated the same way as Aroon UP but this time using the lowest point instead of the highest point.
When a new low is established, the Aroon DOWN indicator reaches 100, and conversely, when a new high is achieved, it will drop to zero.
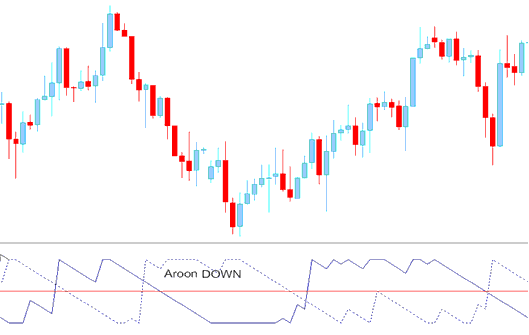
Technical Analysis & Generating Signals
This stock indicator uses the 50% level to measure momentum of the trend.
Buy Trading Signal & exit signal
Aroon UP above 50 is a buy signal
Aroon UP dipping below 50 level is an exit trading signal if you had opened a buy trade.
Sell Signal & exit signal
Aroon DOWN below 50 is a trading sell signal.
An Aroon DOWN moving above the 50 level serves as an exit signal if a sell trade has been initiated in indices.
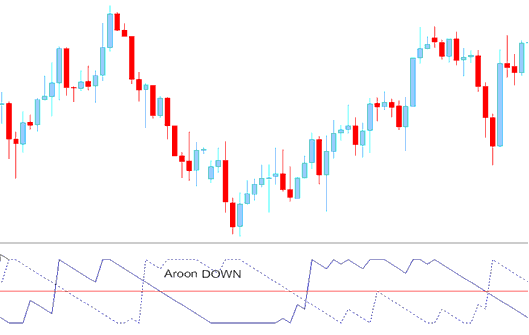
Buy & Sell Trading Signals
Study More Lessons and Topics:
- How to Add Index Trend-Line in Index Chart
- Indicators List in Trading Charts Menu in MetaTrader 4 Trading Platform
- How Can I Place Dow Jones 30 in MT4 iPad App?
- Study How to Trade Nikkei225 Index
- How to Trade Using MetaTrader 4 Practice Demo Account
- Trade SMI 20 Strategy
- IT 40 Strategy List and Best IT 40 Strategy to Trade IT 40
- What Happens in Index after a Bullish Marubozu Indices Candlestick?
- MACD Oscillator Indices Analysis Fast Line and Signal Line
- Study About Index Trade Strategies That Work
