Awesome Technical Analysis & Awesome Trading Signals
Awesome (AO) is a simple moving average from 34 periods, and it is drawn using the midpoints of the bars (H+L)/2, then subtracted from the simple moving average of 5 periods.
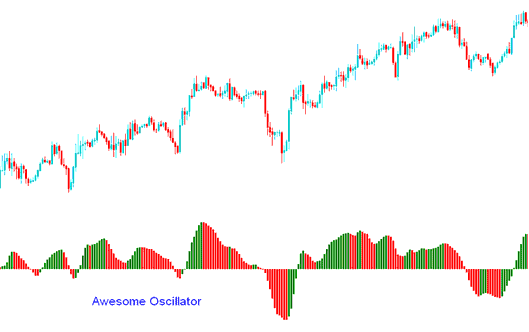
Awesome Oscillator Indicator
Index Technical Analysis and How to Generate Trading Signals
Buy Trading Signal
A buy stock signal generated once the oscillator crosses above the Zero line.
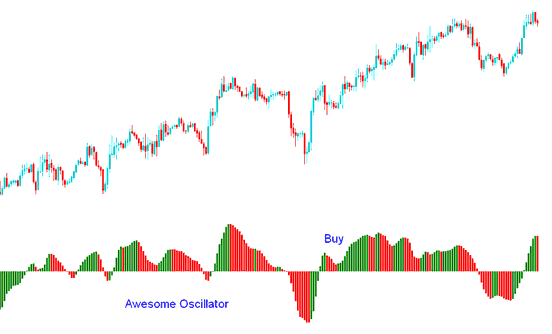
Buy Signal
Another buy stock signal generated when indicator is above the Zero mark and the colour of the bars change from red to green and the green bar is higher than the red bar forming a V or U shape. The signal gets confirmed after 3 green bars are formed & shaped.
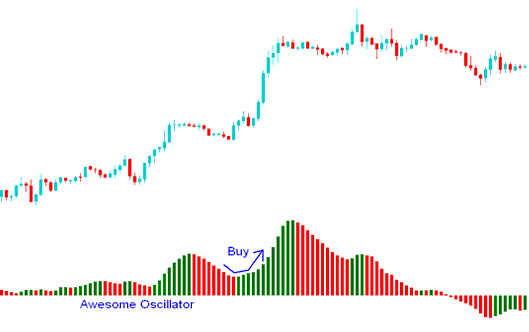
Buy Trading Signal
Sell Signal
A sell stock signal is generated when the oscillator dips below the Zero-line.
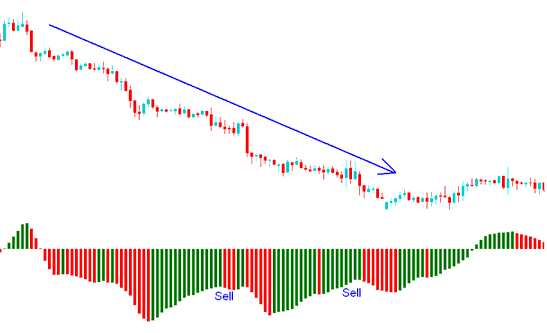
Sell Signal
Get More Tutorials:
- How Can I Interpret Fibonacci Extension Levels on Charts?
- MACD Index Trade Strategy Analysis Summary
- Index Charts Analysis of Stock Index Patterns Guide Tutorial
- How to Get NKY 225 on MetaTrader 5 App
- How to Open MT4 Demo Index Trade Account
- How Can I Download Indices MT5 Platform for Android Phone?
- Ten Index Funds Management Trading Methods
- The Best Index Trade Apps for Index Trade
- Best Index Platform/Software Reviews
- What's the Difference Between Stock Index Cent and Mini Indices Account?
