Bollinger Band
Derived from the original and initial Bollingers.
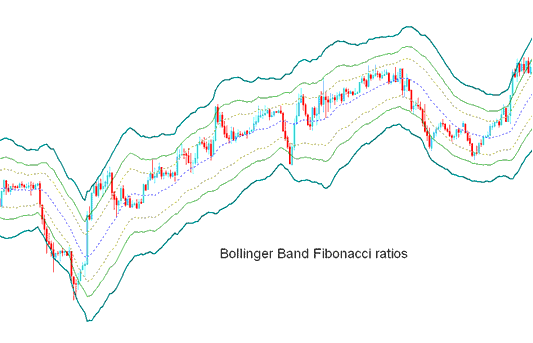
The Bollinger Fib ratios show how much prices change, but instead of using standard deviation to measure band width, it uses a smoothed ATR multiplied by Fibonacci ratios of 1.618, 2.618, and 4.236.
The smoothed lines, when multiplied by Fibonacci ratios, are subsequently either added to or subtracted from the Moving Average.
This forms Three upper Fibo bands and 3 lower Fibo bands
Middle band forms the basis of the trend.
Technical Analysis and How to Generate Trading Signals
This indicator used to identify point of support & resistance for indices.
Lines below represent support levels while those above are resistance areas.
The outer-most bands provide the strongest resistance/support.
The inner most bands provide least support/resistance.
The innermost band represents Fibo 38.2 % retracement level
The second band represents Fibo 50 % retracement level
The outermost band represents Fibo 61.8 percentage retracement level
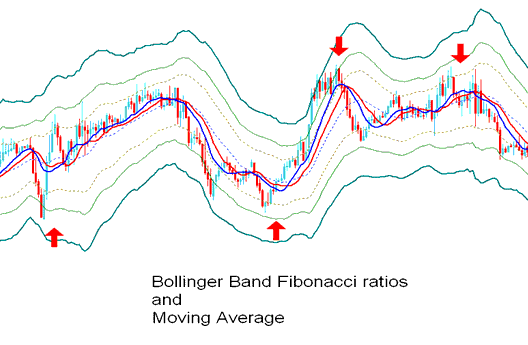
The indicator is used to identify points where indices trading price might reverse. (Price Pull-back Levels)
When the trading price of stock indices touches a line & changes direction, then a signal to trade is generated.
But, it's good to use this signal with other tools like the moving average to be more sure of the signal, as shown in the picture below.
Technical Analysis in Indices Trade
Learn More Guides & Tutorials:
- FTSE MIB MT4 FTSE MIB Software Platform
- Best Strategy to GER30 Training Course
- Day Stock Index Software Platform Online & Online Index Softwares
- How Do You Use Fibonacci Extension Levels in MetaTrader 4 Indices Charts?
- How to Get SX 5E Index in MetaTrader 5 App
- How Can One Generate Index Signal?
- MT4 Index Platform Setup
- How Can I Trade NIKKEI in MT5 Platform?
- How to Get AS 51 Index on MetaTrader 4 iPhone Trade App
- How to Add SPAIN 35 on MT4 iPad Mobile App
