Bollinger Bands Indicator and Price Volatility
When trading price volatility is high: prices close far away from the moving average, the trading Bollinger Band width increases to accommodate more possible trading price action movement which can fall within 95 percent of the mean.
Bollinger Bands indicator will widen as price volatility widens. This will show as the bollinger band bulges around the trading price. When the trading bollinger bands widen like this it's a continuation pattern and trading market will continue heading and going in this direction. This is normally a continuation trade signal.
The Bollinger bands indicator example explained & illustrated below shows the Bollinger bulge.
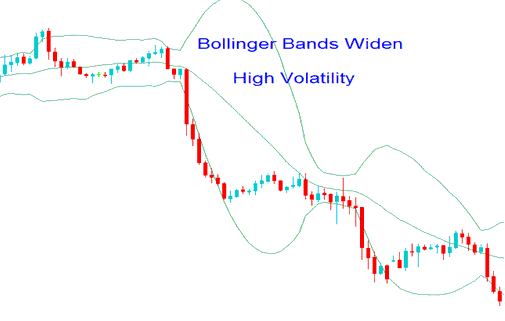
High Price Volatility - Bollinger Band - Bollinger Bands Bulge
Low volatility narrows prices around the moving average. The band squeezes to fit 95% of moves near the center.
Low price swings mean prices consolidate. They wait for a breakout. Sideways Bollinger Bands signal? Stay out. Skip stock trades.
The Bollinger bands indicator examples is illustrated beneath when the bollinger bands narrowed.
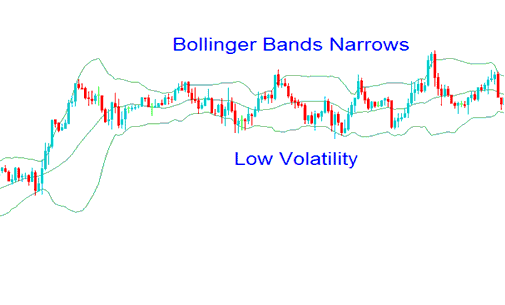
Low Price Volatility - Bollinger Band - Bollinger Band Squeeze
Get More Guides and Topics:
- Moving Average MA Index Cross-over Trading
- How Do You Trade AS51 Index Trading Strategy?
- NKY225 MetaTrader 4 NKY225 Trading Platform
- How Can I Trade EURO STOXX in MT4 Software Platform?
- Aroon Oscillator Stock Index Technical Indicator Analysis in Stock Index Charts
- How to Trade SPAIN35 Tutorial Course Strategy List
- Chande Dynamic Momentum Index Indices Indicator Analysis
- MACD Stock Index Technical Analysis Buy & Sell Index Signals Generation
- How Can I Open Demo MetaTrader 5 Trading Account in MT5 Trading Platform?
- How to Set Up Your Stock Index Charts in MetaTrader 5 Platform
