Bollinger Bands Trend Reversals
If you're trading with Bollinger Bands, wait for the price to touch one of the bands and then start moving in the opposite direction before you call it a reversal.
Even better a stock index trader should see the stock trading price cross over the moving average.
Double Bottom Trend Reversals
A double bottom signals a buy. It happens when the price dips below the lower Bollinger band, then bounces back to form the first low. Later, it forms another low, but this one stays above the band.
The second low price in stock trading should stay above the first low. It must not touch or break the lower Bollinger band. This bullish pattern confirms when price rises and closes above the middle band, the simple moving average.
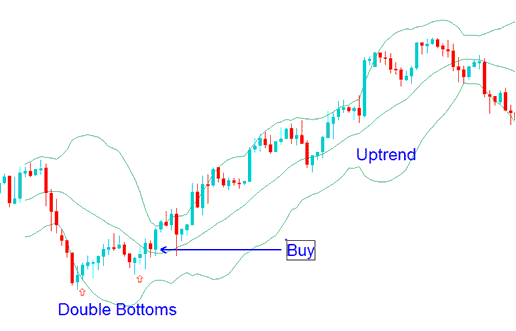
Double Bottoms - Bollinger Band Trend Reversals Strategy Using Double Bottom Patterns
Double Top Trend Reversals
A 'double top' formation serves as a sell signal within stock trading contexts. This pattern develops when the stock's price action initially breaches the upper Bollinger Band, subsequently retracts downward to establish the first peak price, and then, after a period, achieves a second peak that fails to reach the upper Bollinger Band.
The second stock trading price high must not be higher than the first one and it important is that the second stock price high does not touch or penetrate the upper Bollinger band. This bearish setup is confirmed when the stock trading price action moves and closes below the middle band (simple moving average).
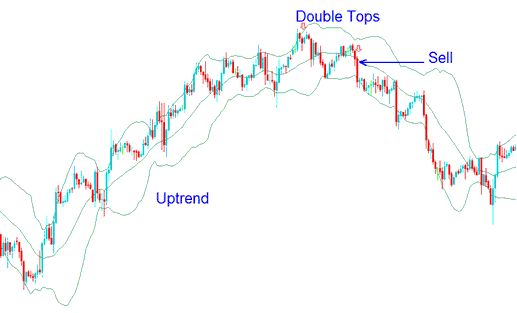
Double Tops - Bollinger Band Trend Reversals Strategy Using Double Top Patterns
Study More Guides:
- Advantages of MQL5 Signals to Sellers and Providers
- Best Strategies to JP225 Tutorial Course
- Stock Index Divergence Strategy using RSI Indicator
- How Can I Add US TEC 100 in MT5 Platform?
- DJ30 Trade Strategies How to Make Strategy for DJ30 Training Tutorial
