How to Use Pivots Points for Day Trading
Stock market participants frequently employ Pivot Points to ascertain areas of support and resistance, basing these calculations on the preceding day's trading activity.
This stock tool helps a lot. It uses past highs, lows, and closes to predict future support and resistance.
This stock indicator assists in identifying the anticipated locations for major support and resistance points. Installing pivot points onto your stock charts allows the indices trading price to potentially react by bouncing off one of these technical thresholds. Stock traders frequently use these identified levels as markers for spotting market highs, lows, or potential trend shifts.
- Daily pivots point levels are calculated from the previous day's high, low, close
This stock indicator is displayed and shown below
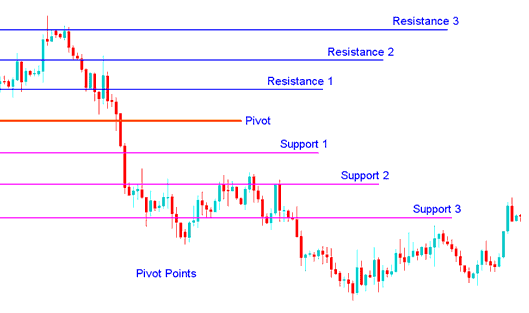
Analysis in Indices Trade
The center pivot point itself is the primary level, which is used to identify the market trend
Additionally, other significant support and resistance zones are crucial in calculating price levels that have the potential to initiate substantial market shifts.
This stock technical indicator can be used in 2 ways
The first way to find the general trend is that if the pivot point goes up, then the stock market is going up, and the opposite is also true. But, pivot levels are short-term trend finders, good for only one day until they must be figured out again.
The second method is to use these points to enter and exit the stock trading markets. This stock indicator is a useful tool that can be used to calculate the areas that are likely to cause stock price movement.
Combine these points and levels with tools like moving averages, MACD, and stochastic oscillator for analysis.
This stock tool has many uses. Here are some of the most common ways that people use these tools for trading stocks and shares.
Trend Direction: If you also use other ways to look at data, such as tools that show when something is too bought or sold, how much prices change, the average point can help find which way prices usually move. You only make trades that follow the way prices are going. You should buy only when the market price is higher than the average point, and sell only when it is lower.
Price Breakouts: A bullish trading signal occurs when the stock trading market breaks up through the center pivot point or one of the resistances (commonly Resistance Zone 1). A bearish signal occurs when the stock trading market breaks downwards through the center point or one of the supports (typically Support Zone 1).
Trend Reversals:
- A buy signal forms when the stock trading price moves towards a support zone, gets very close to this point, touches this point, or only moves slightly through this level, and then reverses and heads back in the opposite market direction.
- A sell stock signal forms when the stock trading price moves towards a resistance level, gets very close to this point, touches this point, or only moves slightly through this level, and then reverses and moves back in the opposite direction.
Stop Loss &/or Limit Profit Values Determined by Support/Resistance: This stock indicator might be potentially helpful in determining suitable stoploss and/or limit profit placements. For example, if trading a long break-out above the Resistance 1 it might be practical to position a stop loss order.
Combining with Moving Average Cross-Over System
Pair the MA crossover with reversal signals. It confirms the shift in direction.
Traders can execute orders following a signal confirmation from two indicators indicating the same directional movement.
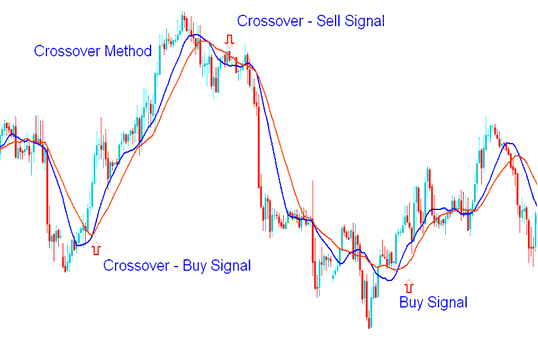
Moving Average Cross-over Technique
The moving average cross-over way can be used with this trading tool to create a trading plan to produce signals to buy and sell stocks.
To download Pivot points Indicator:
https://c.mql5.com/21/9/pro4x_pivot_lines.mq4
Once you download the trading technical indicator. Open it with the MQ4 Language MetaEditor, Then Compile the technical technical indicator by pressing the Compile Button and it'll be added to your MT4.
NB: Once you as a trader add it to your MT4, the trading indicator has additional lines named MidPoints, to remove the additional lines open MQ4 Meta Editor(short cut keyboard key - press F4), and change line 16 from:
Extern bool mid-pivot = true:
To
Extern bool midpivot = false:
Next, click Compile once more, and the indicator will then be displayed exactly as demonstrated and presented on this online portal.
More Lessons:
- 1H Day Trading Stock Index Trading Strategy
- Where to Determine When to Buy in a Upwards Indices Trend
- Stock Index Key Concepts
- Learn About Popular Stock Index Indicators
- How to Begin Stock Index Online Tutorial for Beginner Traders
- FTSE MIB MT4 FTSE MIB Software Platform
- Stock Index Intraday Trading Equity Management
- How are Index Calculated in the Online Market?
- Elliott Wave Indices Trade Theory Explained
- Index Trading Strategy That Work
