DeMark Projected Range Technical Analysis & DeMark Projected Range Trading Signals
Created and Developed by Tom Demark.
This indicator serves to indicate the potential high and low prices that a chart price is expected to reach.
This is called the range projection, and we find it using the starting and ending prices from the most recent time period.
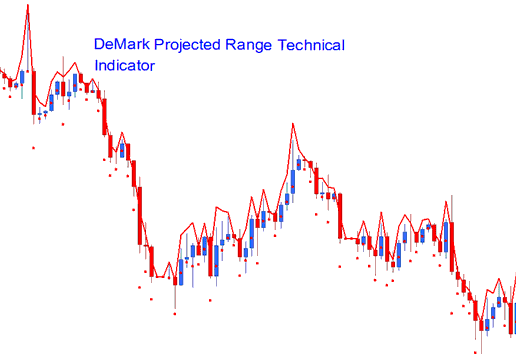
DeMarks Projected Range
Index Technical Analysis and How to Generate Trading Signals
This trading indicator will show two points, the projected high & the projected low of a specific stock price period. This will be used as the reference point.
Bullish Up trend Signal
If the next candle opens above the expected high, the market keeps rising.
Bearish downward trend Signal
If the next price candlestick opens below the projected low then the market will continue in a downwards trend.
Ranging Trading Market
If the next candle opens in the expected zone, expect the market to stay range-bound.
Study More Topics and Tutorials:
- How to Trade FRA40 Lesson Tutorial to Trade FRA 40 Indices
- How to Download MT4 Index Platform/Software for IOS
- Index Analysis Concepts
- US30 Indices Strategy and US30 Forex Strategy
- Technical Analysis of the Moving Average Indicator
- How Can I Add GER 30 on MT5 iPhone App?
- How Do You Draw Upward Trendlines in MT5 Platform Software?
- How Do You Trade SX 50 Indices Strategy?
