Index Long and Short and Charts
In stock indices trading, there are 2 types of trades, these are:
- Long (buy) - long is if the trend is buy/bullish.
- Short (sell) - short is if the price trend is sell/bearish.
Buying/Long and Selling/short in Stock Index Trading
Both terms in Indices Trade, refer to things we do when execute a trade.
Buying Long -indices trading term to use when buying and when opening a trade.
Selling short -indices trading term to use when selling & when registering and opening a trade.
"Long" is an alternative designation for initiating a purchase within index trading. If a trader goes long, it signifies they have bought the asset with the expectation of upward price movement. When the market price action advances along an upward trajectory in indices, this directional bias is customarily labeled as a bullish stock trend.
Short - Short is a term used to refer to selling of a trading instrument which is going in a downwards trend direction. When the price is going downwards then it is known as to as a bearish stock trend.
Basically the term, "selling short" can be refer to selling in the trading markets. Short selling involves trading an instrument anticipated to lose value relative to another asset. When such an index is sold, it reflects a position where value is transferred away from this trading instrument and held in another form - often in U.S. dollars - against which this instrument is measured.
Buy/Long
If the trading price is heading up we buy, this is known & referred to as going long - Hence long is just another name for buy. When the trend is moving up it is known as bullish, this is when a buy trade is placed. A bullish indices trend is identified by drawing an upward indices trendline on a chart. The example illustration explained & shown below shows a long/buy signal.
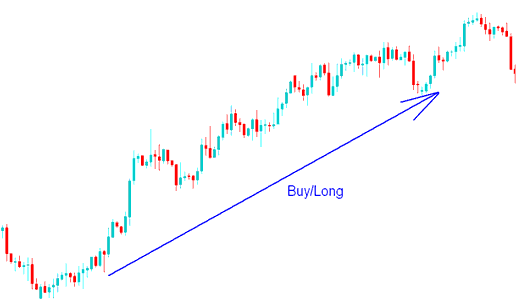
Buy/Long
Sell/Short
If the price is going downward we sell, this is referred to as going short. When price trend is going downward it is known as to as a bearish. The example expounded & shown below shows a downward trend, this is when a short sell is placed. The short/sell is identified by drawing a downwards trendline on a chart. The example illustration explained & shown below shows a short/sell signal.
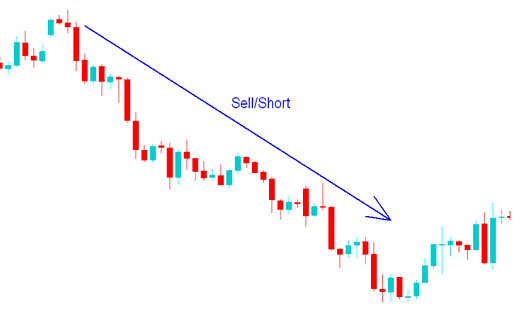
Sell/Short - Indices Buy Trade & Stock Index Sell Trade
Charts
A stock chart is a picture that shows how trading prices (on the side going up and down) change over time (on the side going left to right) for indices. The way market prices move is marked and drawn on these charts. The chart can be drawn as candle charts like the one below, or as line charts or bar charts.
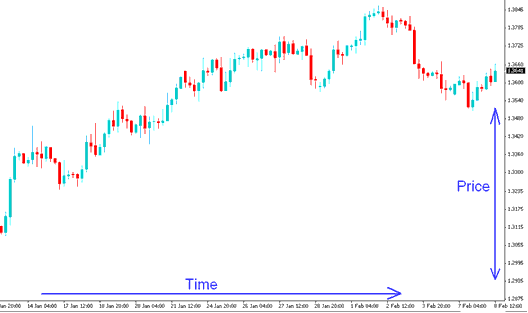
Chart - Candles Charts
The three common types of charts used in indices are:
- Candlesticks Charts
- Line Charts
- Bar Charts
These three chart types are covered in the chart types section.
Trading Software
This is the software a broker provides to help stock traders make their trades easily. After you, as a trader, download and set up this software on your desktop computer, you can begin trading in the stock market. All stock trades happen through this software. If you, as a trader, want to learn a trading platform, MetaTrader 4 Software is a great stock software to begin with.
To set these orders, open MetaTrader 4 Software, open a "chart", right click in "chart", select and choose 'New Order", then select the trade order either buy or sell as pictured below. (Short-Cut key board Keys - Press "F9")
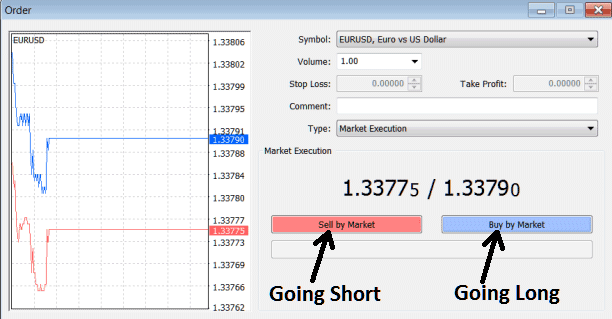
Placing Buy Long Order and Sell Short Order on the MT4 Platform
Study More Lessons:
- Trade Index MT5 Trade Platform
- MetaTrader 4 Index Software/Platform
- How Can I Add EURO STOXX 50 in MT4 Platform?
- What's S & P 500 Trading Chart?
- Index Trade MT5 Introduction to MT5 Interface
- What's Index Stop Out Index?
- Index Trade Best Index Trade Online Tutorial Guide
- Index Trade US TEC 100 in FX
- Which Online Broker Can Use for Indices SMI20?
- S&P Index Trade Indicator on Trading Platform Software
