MACD
Created by Gerald Appel,
The MA Convergence/Divergence is among the simplest, most reliable, and frequently used technical indicators.
It's a momentum oscillator and also a trend following indicator.
Construction
This trading indicator is created by figuring out the difference between two moving averages and then showing it as a 'Fast' line. The second 'Signal' line is then figured out from the first 'Fast' line and then shown on the same window as the 'Fast' line.
- 'Fast' line - Blue Line
- 'Signal' line - Red Line
For the ‘standard' MACD, the 'Fast' line uses a 12-period and a 26-period exponential moving average. Add a 9-period exponential moving average to the fast line to draw the 'Signal' line.
- Fast-line = difference between 12 & 26 exponential MAs
- Signal-line = moving average of this difference of 9-periods
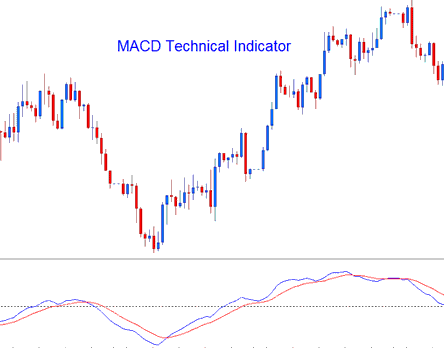
Stock Technical Analysis and Generating Signals
The MACD is oftenly used as a trend following indicator and works most efficiently when interpreting the trending market movements. The 3 common techniques of using MACD indicator to generate signals are:
Stock Indices Cross-Overs Signals:
Fast-line/Signal Line Cross-over:
- A buy signal gets generated when the Fast line crosses above Signal line
- A sell stock signal gets generated/derived when the Fast line crosses below the Signal line.
But, in a market with a strong trend, this stock signal gives a lot of false signals. So, the best cross-over signal to use would be the Zero Line Cross-over Signal, which doesn't give as many false signals.
Zero Line Crossover Signals:
- When the FastLine crosses above zero center line a buy stock signal is generated.
- when the FastLine crosses below the zero center line a sell stock trading signal is generated.
Divergence Trading:
Checking for differences between the MACD and price can be very helpful in finding possible points where the price trend might reverse or keep going in the same direction in stock trading. There are two kinds of divergence setups:
- Classic Divergence Trading Setup Signals
- Hidden Divergence Signals
Overbought/Over-sold Conditions:
Traders use the MACD indicator to detect possible overbought or oversold spots in stock prices.
These levels and regions are derived & generated if the shorter MACD indicator Lines separate significantly from the median, this is an indication that stock price action is over-extending & it will soon return to the more realistic levels.
MACD and Moving Average Indices Cross Over System
This stock tool can be used with others to create a way to trade stocks. It works well with the MA crossover trading method. A signal happens when both give a signal to trade in the same way.
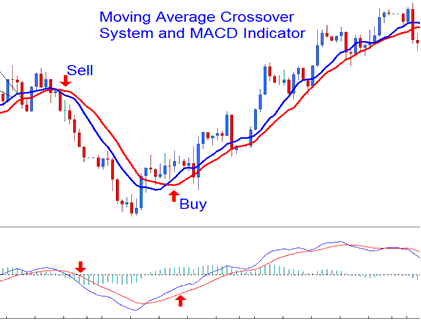
Technical Analysis in Indices Trade
Study More Guides and Topics:
- What is The SX 5E Index in Trading?
- ADX Index Indicator
- How to Add EU 50 in MT5 Android App
- Pips Calculator DowJones30 Pip
- How to Add a Stock Index Sell Stop Order on MetaTrader 5 Stock Index Chart
- How Can I Add Dow Jones 30 in MetaTrader 4 Android App?
- How to Find AS 51 Index on MetaTrader 4 iPhone Trade App
- Where Can Find DJ 30 in MT4 Software Platform?
