MACD Oscillator Indicator Technical Analysis Fast Line & Signal Line
MACD indicator is used in various ways to give technical analysis data.
- MACD centerline crosses show bearish or bullish markets: below the zero is bearish, above zero is bullish.
- MACD Cross-overs indicate a buy/sell signal.
- Oscillations can be used to indicate oversold & over-bought regions
- Used to look for divergence between stock price & indicator.
Construction of MACD
The MACD technical indicator uses two exponential moving averages and draws two lines on the chart. The default moving averages are 12 and 26, and there's a smoothing factor of 9 applied when drawing the MACD.
Summary of how MACD indicator is drawn
MACD uses 2 EMAs + a smoothing factor (12, 26 Exponential MAs and 9 smoothing periods)
MACD technical technical indicator only plots 2 lines - the MACD fast line and the MACD signal line
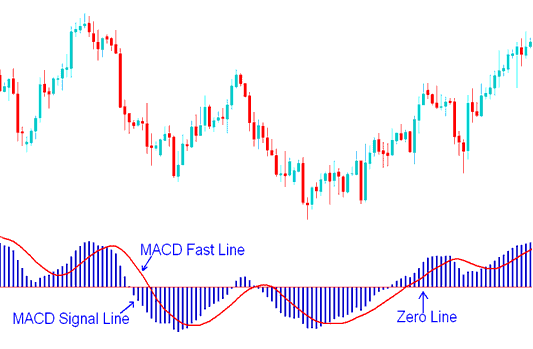
MACD Lines - MACD Fast-Line and MACD SignalLines Trading Signals
- The FastLine is the difference between the 26 EMA and 12 EMA
- The Signal-line is the 9 period moving average of the MACD fastline.
Implementation of MACD
The MACD tool shows the MACD line as a solid line. The signal line appears as bars. Traders use their crossovers for signals.
The MACD centerline acts as the zero line, a neutral spot between buyers and sellers in the market.
Values situated above the central reference point are interpreted as favorable trading signals, whereas those beneath suggest negative stock signals upon analysis.
The MACD indicator being an oscillator, oscillates above & below this centerline.
Learn More Tutorials:
- How to Analyze MT4 Index Indicator Kase Peak Oscillator
- Index Trader Calculator Index App
- Stochastic Indicator Overbought and Oversold Levels
- How Do You Interpret Stock Index Chart for Beginners?
- EU 50 in MetaTrader 5 Described
- How to Place Nas100 in MetaTrader 4 Android Trade App
- How to Place Relative Strength Index, RSI Indicator on Stock Index Chart
