MetaTrader 4 Data Window
MT4 Data window illustrates information about a price, for a specified candle period. For illustration the trading charts below, shows how to choose data panel window from view menu options.(Ctrl+D is short-cut key for displaying data panel window without having to access it from the view menu)
Data Window - MT4 Platform
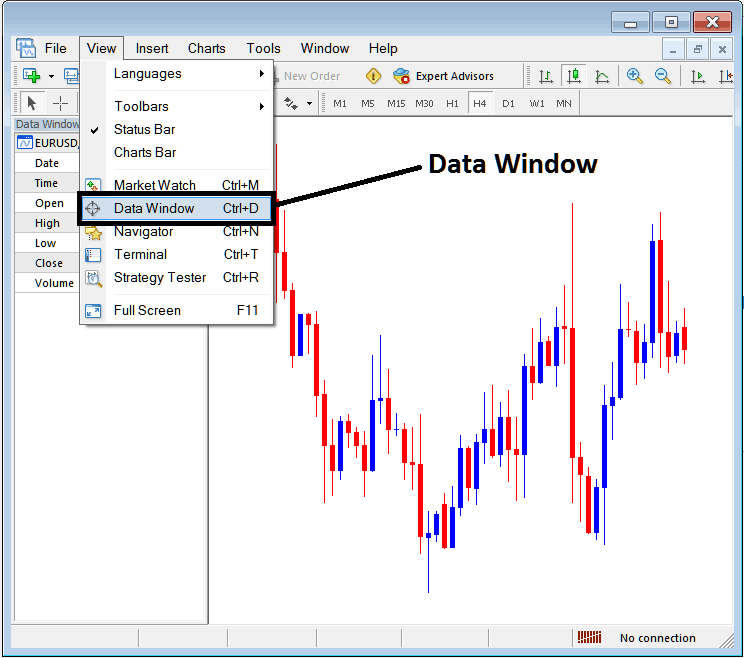
once the information panel is chosen it'll show, the following statistics approximately a charge.
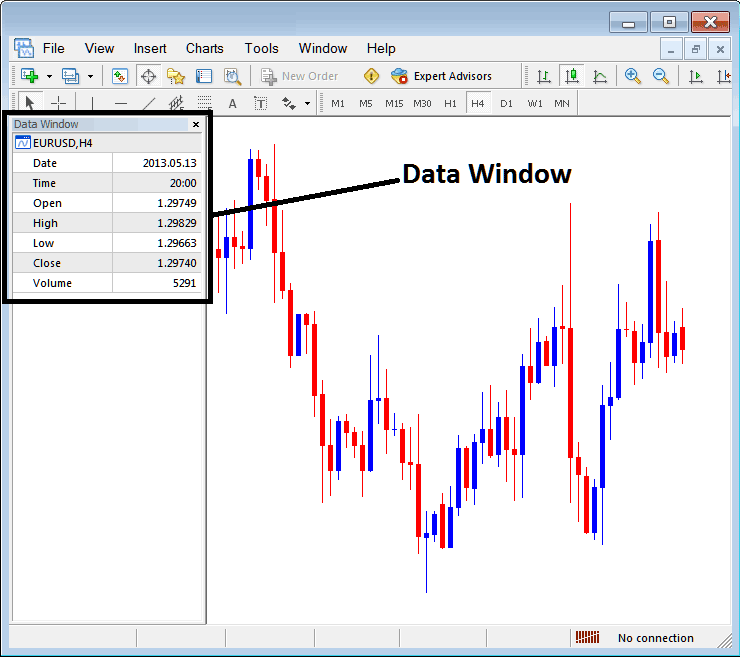
The following data for indices is shown:
- Chart
- Date
- Time
- Open Price
- High
- Low
- Close Price
- Volume
This data will show info for a particular candlestick, by scrolling your mouse over the candlesticks on a trading chart this information will change to reflect the price candlestick which the mouse has pointed at.
The data window is not popularly used in the MetaTrader 4 Platform Software as compared to the other MetaTrader 4 stock chart windows. However as a stock indices trader you can use this data panel to extract and display info & data about any price candle & the market prices associated with this candlestick like the opening price information, closing price data and high & low of price.
Because most people who trade stocks can get this information straight from the trading charts, these traders may want to use information that's easy to find on the chart within the MT4 platform.
Another way to grab data is the Cross-Hair Mouse Pointer. Press and hold the mouse wheel to show it. Traders get the cross hair that way. If your mouse lacks a wheel, buy one for MT4 cross hair trading. From it, pull price info like this example.
Cross Hair Tool - MT4 Software
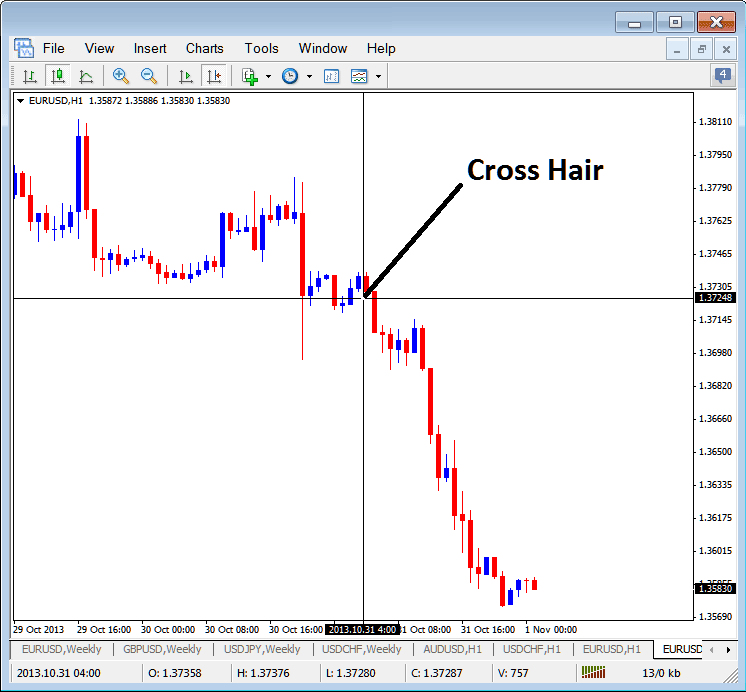
From the Cross Hair above the vertical line will show information on the date for the current candlestick, the horizontal line will show price at that particular point on the chart. For the above example of chart you can see that the date is 2013.10.31 4:00GMT & the Price is shown for the selected point. The Open, High, Low, Close & Volume as well as the Date is Shown and Displayed Just below the Charts tab at the bottom of the MetaTrader 4 Platform, Marked as O: H: L: C: V: therefore the cross-hair is a short cut technique of viewing data information instead of going to the Data Panel Window of the MT4
A trader can click on a point, hold down the mouse button, and drag the mouse to another chart level to measure the pip movement of price from one point to another on the charts in the MetaTrader 4 Software, as illustrated below.
Using Cross Hair Mouse Pointer Tool to Measure Pip Price Movement
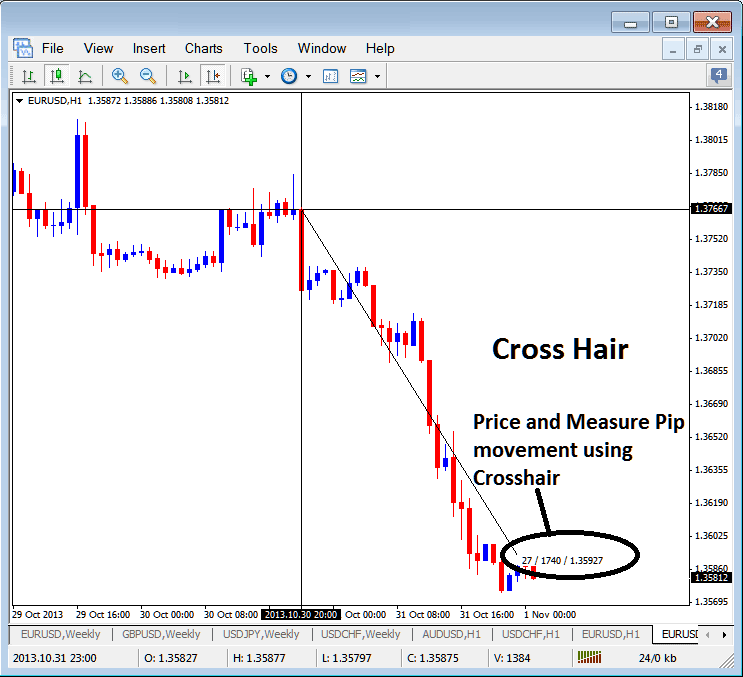
Cross-Hair Data Tool in MT4 Platform
Learn More Courses & Tutorials:
- Can You Trade S&P in MT5 Software Platform?
- Is MT4 Only for Index Trade?
- US 100 Strategy Training Guide
- How Can I Trade UsTec 100 Lesson Tutorial Strategies Listing?
- Best Strategy to Trade NKY225 Lesson
- How Can You Set Fib Levels Indicator on the MT5 Platform Software?
- Classic Divergence Index Setup
- IT 40 Trading Strategy Example
- How to Add Fibonacci Extension Levels in Trading Platform Software
- How to Add Relative Vigor Index, RVI Indicator on Index Chart
