Pin bar stock trading price action method
A pin bar is a reversal stock signal on a stock chart which displays an obvious change in sentiment during that period.
This bar has got a long tail with closing stock price near the open.
Bar looks like a pin thus the name Pin Bar - forms after an extended trend move upwards or downward.
This switch is verified after the market ends below the candle before this setup. Below the change is verified after the stock trading market ends below the blue candle before this candlestick.
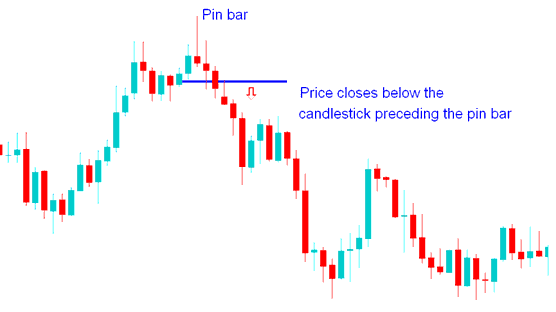
Combining Together with line studies:
This signal can be used with other line tools like levels of Support and Resistance, Fibonacci retracement levels and trend-lines to help decide when to buy or sell stocks.
Support & resistance
If a pin bar forms after the stock price hits a key support or resistance level, that's your signal to enter the market. When you see this setup, you want to trade in the opposite direction of the pin bar's tail.
If the stock market rises and forms a pin bar with a long upper shadow, the signal is to short.
If the stock market falls and forms a pin bar with a long lower shadow, the signal is to go long.
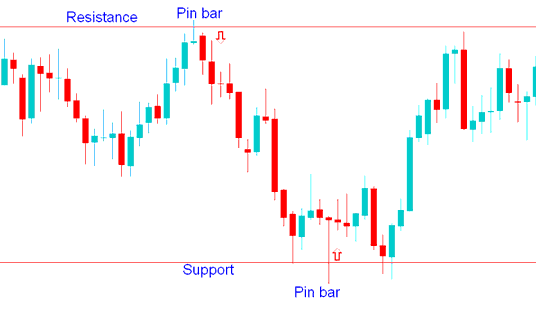
Combining with Support & Resistance
Trendlines & moving averages
Pin bars after a stock price hits a trend line or moving average (MA) can signal when to enter the stock market.
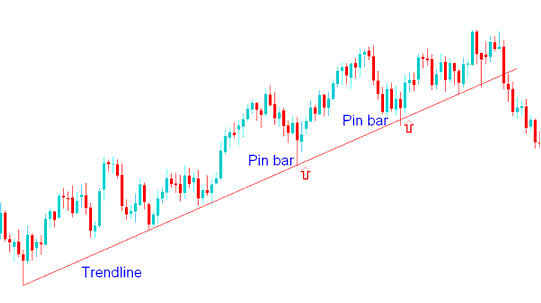
Combining Together with Trend-Lines
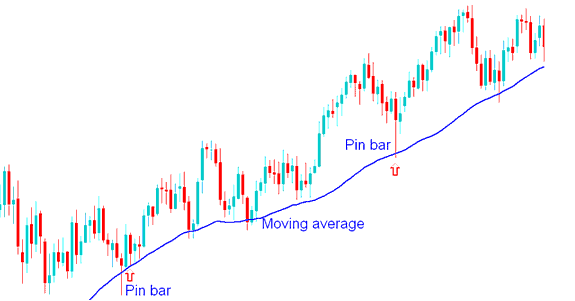
Combining with Moving Averages(MAs)
Indices Fibonacci Retracement Levels
Pin bars that form after stock trading price touches/tests a Fib retracement level also can be used as signals to enter the stock trading market.
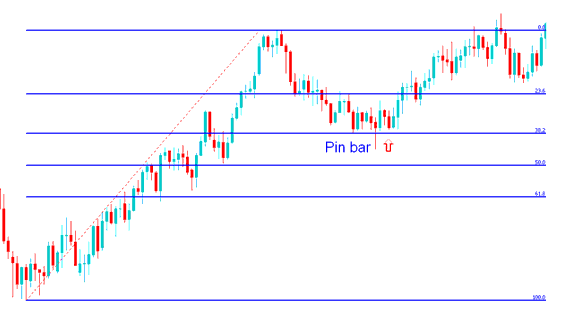
Combining Together with Fib Retracement Zones
These patterns often appear when the market is swinging a lot, and they often occur after false breakouts. This is why this setup is used to make trades in the direction that goes against the tail's trend.
More Lessons and Topics:
- What is Margin Requirement for 1 Contract of WallStreet 30 Index?
- HSI 50 Trade Strategies and HSI 50 Strategy
- How to Place IT40 in MT5 Android App
- Stock Index Average True Range Technical Indicator Analysis
- Index Trader Calculator Stock Index App
