Price Action 1-2-3 method in the Indices Market
Price action refers to the practice of trading indices solely based on charts, without the use of chart indicators. This technique involves the use of candlestick charts. The strategy relies on lines and predefined patterns, such as the 1-2-3 pattern, which may develop or form a sequence of bars.
Traders use this way of doing things because it is very clear and lets them look at how the market is moving based only on what they see on the charts and market movements.
Many traders use this strategy. Even those with indicators add some price action to their approach.
This technique works best when the signals it makes are used with line tools for more proof. These line tools are things like trend-lines, Fibo retracement, and support and resistance levels.
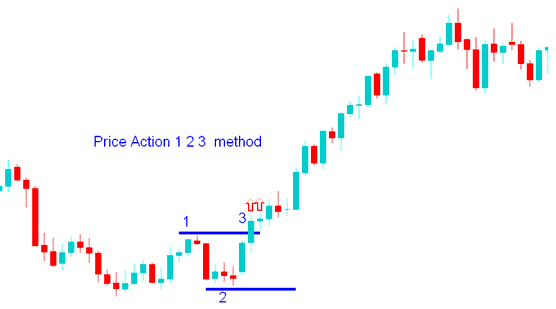
Price Action 1-2-3 Break-out
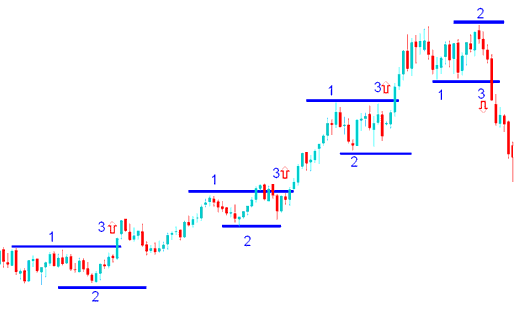
This trading plan uses 3 points on a chart to figure out which way indices will break out. The 1-2-3 method uses a high point and a low point: these create point 1 and point 2. If the market goes above the high point, the signal is to buy: if it drops below the low point, the signal is to sell. A break out of point 1 or point 2 creates the third point.
Series of break outs on Chart
Investors use price action to guess where a trend might be headed. The market is either going in a direction or staying flat.
A market exhibiting a trend moves consistently in a singular direction, whereas a range-bound market oscillates horizontally, typically after reaching a support or resistance boundary.
Observing the behavior of price action provides this data of whether the market is trending or ranging or reversing its direction.
Like any other way of trading Indices, this method should be used with other signs that confirm what you're seeing, so you don't get false signals. The 1-2-3 pattern can give good signals when the market is going in a clear direction, but it will give false signals when the market is staying in a limited range. It's best to know if the market is going in a direction or not before you use this way of trading.
Combining Together This Strategy with other Trading Indicators
Good technical indicators to combine with are:
- RSI
- Moving Average Indicator
Investors should leverage these two indicators as confirmation tools to verify alignment between the direction of a perceived breakout and the price trend indicated by these two trading indicators. If the breakout direction matches the signals from these indicators, traders can then execute a trade in that established direction. If the directions conflict, investors should refrain from trading, as the perceived signal is likely to be a misleading indices whipsaw.
Just like any other indicator in Stock Index Trade, stock price action also has whipsaws and there's a requirement to use this strategy as a combination together with other trading signal strategies as opposed to just using this strategy alone.
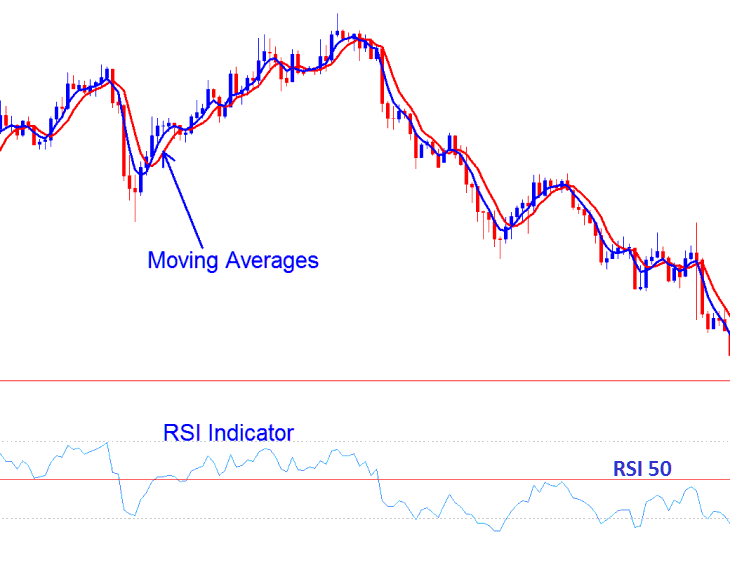
Combining with other Technical Indicators - RSI and Moving Averages
Study More Guides & Topics:
- How Can I Add DJI30 in MetaTrader 5 App?
- Gann HiLo Activator Index Indicator Analysis
- Index Strategies for DJI30 in FX
- What's FTSE100 Spreads? FTSE 100 Spread
- How Do You Analyze the Three Types of Index Charts?
- Best Index Platform/Software for Indices
- JP 225 Strategy Training Guide
- What Does 50% Indices Margin Requirement Mean in Index Trade?
- How to Place SMI 20 on MT4 Platform
- Calculate Value/Size of 1 Pip of DAX 30 Indices
