Rate of Change Technical Analysis & Rate of Change Signals
Rate of Change figures out how much the price has changed over a specific number of trading price bars. It finds the difference between the current candle and the price of a certain number of candles before.
You can measure this difference in points or percentages. The Rate of Change (ROC) swings above and below a zero line - that's just how it moves. When it's above zero, things look bullish: when it dips below, that's bearish territory.
The greater the fluctuations in trading prices, the more significant the changes in the Rate of Change (ROC).
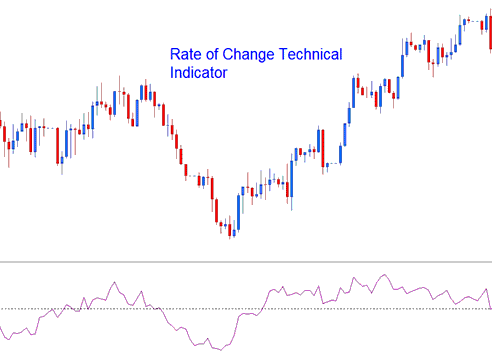
Stock Technical Analysis and How to Generate Trading Signals
ROC technical indicator can be used to generate signals using a No. of methods & techniques, the most regular ones are:
Stock Index Cross-Over Signals
Bullish Signal - buy signal gets generated when the ROC crosses above zero center line
Bearish Signal - sell signal gets generated/derived when the Rate of Change crosses below the zero center line.
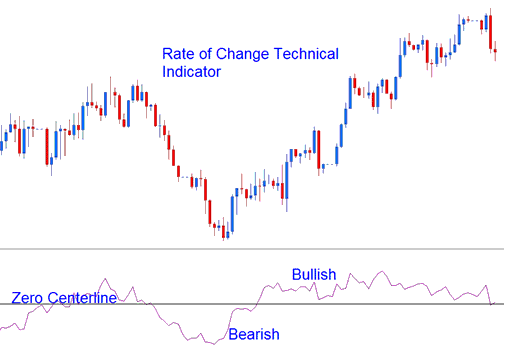
Overbought/Over-sold Levels:
Overbought - The higher the reading the more overbought indices is. Values that are above the over-bought level imply that a price is overbought and there is a pending price correction
Oversold means the lower the value, the more oversold the indices. Below that level, a price rally waits.
However, during strong trending markets the price will remain in the Over-bought/Oversold Levels for a long time, & rather than the price reversing the price trend will continue for quite some time. It is thence best to use the crossover signals as the official buy & sell stock signals.
Indices TrendLine Breaks
Index Trend-lines can be marked on the ROC technical tool like trendlines on price charts. Since the ROC shows what's coming, the trend-lines on it will break before those on price charts. A broken trend line on the Rate of Change means a possible signal of prices going up or down.
- Bearish reversal- ROC values breaking above a downward trendline warns of a likely bullish market reversal.
- Bearish reversal- Rate of Change values/readings breaking below an upwards trend line warns of a likely bearish market reversal.
Divergence Trading
Rate of Change can be used to trade divergences, and to identify the potential price trend reversal trading signals. There are four types of divergence-setups: classic bullish, classic bearish, hidden bullish & hidden bearish divergence.
More Topics and Lessons:
- How to Analyze a Index Retracement on a Downwards Indices Trend
- Learn How to Trade IBEX35 Stock Indices
- FTSE MIB 40 Indices Signal Strategy
- How Can I Place SMI 20 in MT5 Android App?
- How to Get WallStreet 30 Index in MetaTrader 5 App
- How Can I Add SX 5E in MT5 iPhone App?
- Bollinger Band Bulge vs Bollinger Band Squeeze
