RVI Technical Analysis & Relative Vigor Trading Signals
Developed and Created by John Ehler
The RVI takes old trading ideas and mixes them with new digital signal processing theories and filters to make a trading indicator that is useful and realistic.
The basic principle behind it is simple -
- Prices will tend to close higher than they open in up-trending markets and
- Prices close lower than where they open in down-trending markets.
So, how strong the move is will be shown by where prices end up when the candlestick closes. The RVI shows 2 lines, the RVI Line and the trade signal Line.
The RVI index fundamentally measures the average difference between closing and opening prices, which is then averaged against the typical daily trading range and subsequently plotted.
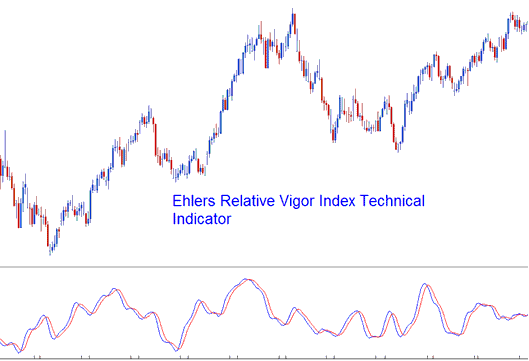
It acts as a quick oscillator. Turning points match stock price cycles.
Technical Analysis & How to Generate Signals
RVI is an oscillator. The basic technique of interpreting the index is to use the cross-overs of the RVI & the SignalLine. Signals are derived/generated when there is a cross-over of the 2 lines.
A buy stock signal hits when RVI crosses over the signal line.
Bearish Signals - a sell stock signal occurs when the RVI crosses below the SignalLine.
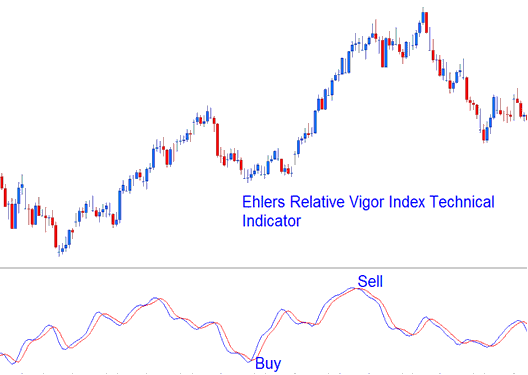
Buy and sell stock signals derived/generated using the crossover method
Learn More Tutorials & Courses:
- How Do You Interpret Fib Extension Levels on Stock Index Charts?
- SMA, EMA, LWMA and SMMA. Types of Stock Index MAs MAs Moving Averages MAs
- How Do I Set NASDAQ 100 Stock Index in MT4 Software Platform?
- Study How to Trade SX5E Index Guide
- Study Index Trend Following Strategies
- Grid, Volumes, AutoScroll & MT4 Chart Shift on MT4 Software
