Bullish Stock Candle Patterns and Bearish Stock Candle Patterns
Bullish Candlestick Patterns Tutorial Course & Bearish Stock Candlestick Patterns Lesson
Reversal candle stick patterns form after an extended prior market trend. Hence, for a candle pattern setup to qualify as a reversal setup there must be a prior market trend.
These reversal candle patterns are:
- Hammer Candlestick Pattern and Hanging Man Stock Candlestick Pattern
- Inverted Hammer Candlestick Pattern and Shooting Star Stock Candlestick Pattern
- Piercing Line Candle Pattern and Dark Cloud Stock Candlestick Pattern
- Morning Star Candlesticks and Evening Star Candles
- Engulfing Candles Patterns
Hammer Candlestick Pattern & Hanging Man Candlestick
Hammer Candlestick Pattern Hanging Man Candlestick Pattern candlesticks look similar but hammer is bullish market reversal trading pattern & hanging man candle is a bearish market reversal trading pattern.
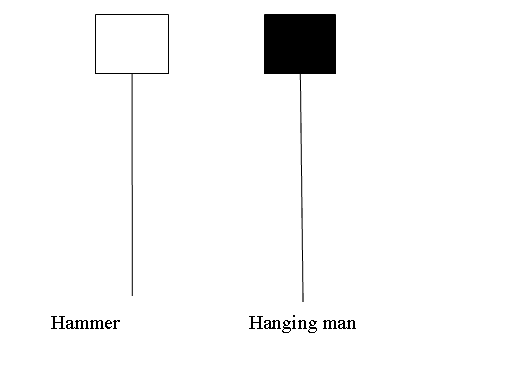
Hammer Candlestick Pattern & Hanging Man Candlestick Pattern
Hammer Candlestick
Hammer is a potentially bullish pattern which occurs during a downward trend. It's named & called so because the stocks market is hammering out a bottom.
A hammer has:
- A small body
- The body is at the top
- The lower shadow is 2 or 3 times the length of real body.
- Has no upper shadow or has a very small upper shadow if present.
- The colour of the body isn't important
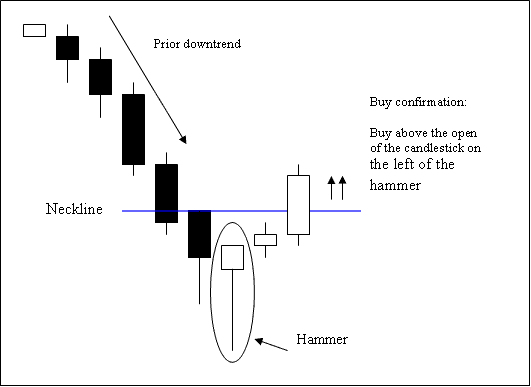
Hammer Candlestick
Technical Analysis of Hammer Candle-sticks Pattern
A buy signal confirms when a candle closes above the open of the candle just before the hammer pattern.
Stop orders should be set a few pips just below low of the hammer candlestick.
Hanging Man Candlestick
This setup is a bearish reversal signal during an uptrend. It's called a “hanging man” because the pattern kind of looks like a person hanging from a noose.
A hanging man candlestick has:
- A small body
- The body is at the top
- Lower shadow is 2 or 3 times the length of real body.
- Has no upper shadow or has a very small upper shadow if present.
- The color of the body isn't important
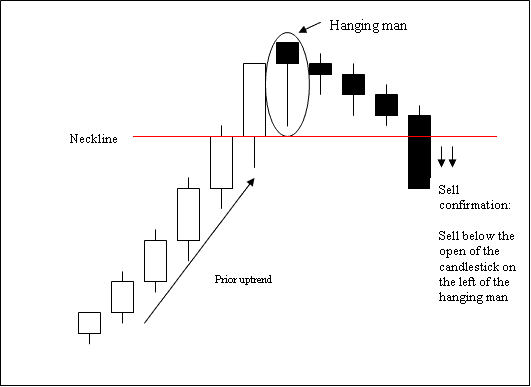
Hanging Man Candlestick
Trading Analysis of the Hanging Man Candles
A sell signal confirms when a bearish candle closes below the open of the candle before the hanging man pattern.
Stop orders should be set a few pips just above high of hanging man candlestick.
Get More Guides & Guides:
- What is Margin Requirement for 1 Contract of EU50 Index?
- Where Can Find IBEX in MT5 Platform?
- Where Can I Study How to Trade Index in MetaTrader 4 App
- How to Add IT 40 in MetaTrader 4 iPad App
- Stock Indices Strategies for Stock Index NIKKEI 225 Stock Indices
- Transforming Your Stock Index Trade Psychology Mindset To Improve Your Stock Indices Trade
- MACD Index Trading Method Technical Analysis Summary
- How Can I Place SWI 20 in MT5 iPhone App?
- Trade Strategies for Trading SMI 20 Indices
