RSI Hidden Bullish Divergence & Hidden Bearish Divergence Setups
Hidden divergence in stocks signals trend continuation. It happens when price pulls back to test old highs or lows.
Hidden RSI Indices Bullish Divergence
Hidden RSI bullish divergence in indices trading forms when price makes a higher low. The oscillator shows a lower low.
Hidden bullish divergence occurs when there is a retracement in a up-wards trend.
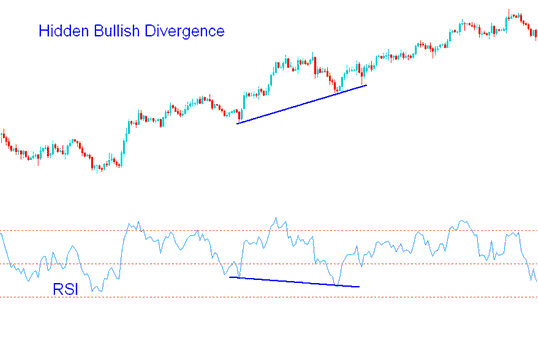
RSI Hidden Bullish Divergence - Hidden Divergence Setup
This hidden stock divergence set up confirms that a retracement move is complete. This hidden stock trade divergence indicates underlying power of an upward indices trend.
Hidden RSI Bearish Divergence
In hidden RSI indices trading, a bearish divergence setup appears when the price hits a lower high, but the indicator shows a higher high.
Hidden bearish divergence is identified when there is a pullback during a downward trend.
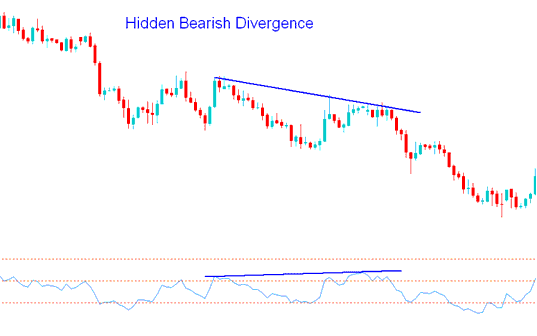
Index Hidden Bearish Divergence - Hidden Bearish Divergence Trade Setup
This hidden bearish indices trading RSI setup shows that a market pullback is done. This difference shows the strength of a downward trend.
Get More Lessons and Tutorials & Courses:
- S&P MetaTrader 5 S&P Platform Software
- How to Get WallStreet 30 Index in MetaTrader 4 App
- Types of Stock Index Strategies
- Money Management Trade Index Risk Management
- How to Find AS 51 Index on MetaTrader 4 iPhone Trade App
- Hidden Bullish Divergence MACD vs Hidden Bearish Trading Divergence MACD
