RSI Swing Failure Setup
RSI indices swing failure can be a very accurate method for trading short term moves. It also can be used for trading longterm trends but it is best fitted for short term trading especially for those traders that trade reversals.
The RSI swing failure swing setup tells you that the market price is likely to change direction. This trading setup is a signal that a breakout is coming, and it warns that a support or resistance level is going to be broken through. This should happen when readings are above 70 for an uptrend and below 30 in a downtrend.
Swing Failure In an Upwards Indices Trend
When RSI hits 79, pulls to 72, climbs to 76, then falls under 72, it forms a failed swing. The 72 acts as support, now broken. Price should follow and smash its own support.
In the trading example illustration explained & shown below, the trading RSI hits 73 then retraces to 56, this is a support level. The indicator then rises to 68 & then drops to below 56, thus breaking the support level. The price then follows afterwards breaking its support level. The RSI swing failure is a leading signal and it's confirmed when stock price also breaks it support zone. Some traders open trade transactions once the swing failure is complete while the other traders wait for the price confirmation, either way it's for a stock indices trader to decide on what method works best for them.
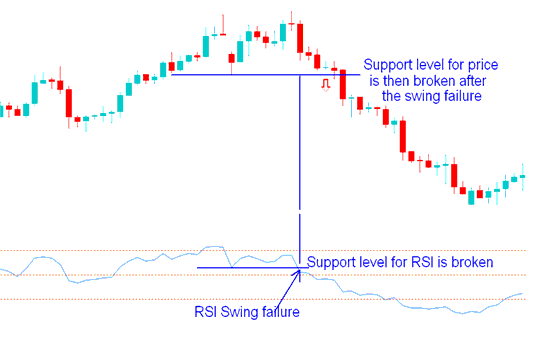
RSI Swing Failure Setup in an Upward Indices Trend
Swing Failure Setup In a Downward Indices Trend
If the trading RSI Technical Indicator touches 20 then pulls back/retraces to 28, then falls to 24 & finally penetrates above 28, this is considered a failure swing setup. Since the 28 level is an RSI resistance level & it has been penetrated it means that price will and follow & it'll penetrate its resistance level.
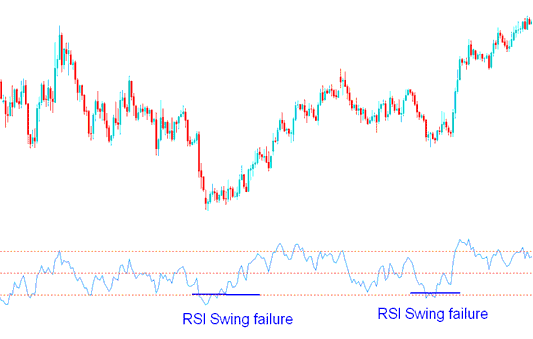
RSI Swing Failure Setup in a Downward Indices Trend
Study More Topics & Courses:
- MetaTrader 4 Index Platform/Software Ichimoku Indices Indicator
- How to Place AS51 on MetaTrader 4 iPhone App
- Placing Channels in Stock Index Charts in MT4 Platform
- Can You Start Index with $1,000 for Mini Indices Account?
- Strategy for AEX25 Trading
- How Can I Find DJI30 in MetaTrader 5 Mobile App?
