Stochastic Indicator Over-bought & Over-sold Levels
Stochastic oscillator finds overbought or oversold spots. Overbought tops 80%, oversold dips under 20%.
The key is to not only look at Stochastic oscillator indicator when the %K or %D lines touch or cross overbought/over-sold, but also when they cross-over and back through these technical levels.
Just as with other trading momentum indicators such as RSI the Stochastic oscillator indicator can stay inside the overbought & oversold levels for some time. When this trading stochastic oscillator stays within these levels for a long time it indicates strong upwards trend (overbought) or strong downward trend (oversold).
Stochastic lines crossing back over overbought or oversold levels signal a trend reversal. It often points to a market shift.
Traders can seek extra signals to strengthen overbought or oversold readings in these cases.
Buy Trading Signal Using Stochastic Indicator Technical Indicator Oversold Levels
- Before and Prior to Buying, the %K and %D lines turn upwards from below 5%.
- A reading that is floating near 5% means that indices trading bears are in control and there is selling of indices. A trader should wait for the Stochastic Indicator to move back above 5% as a sign that the selling pressure is easing.
The Buy signal is confirmed when the stochastic oscillator trading moves above oversold, then after a while returns to oversold but this time it moves up immediately without it staying at the over-sold.
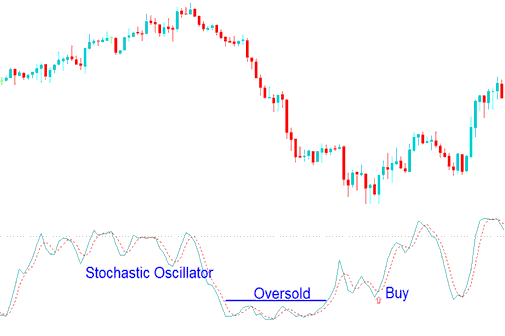
Buy Signal Using Stochastic Indicator Over-sold Levels
Sell Signal Using Stochastics Indicator Over-bought Levels
- Before and Prior to Selling, the %K & %D lines turn downward from above 95 %.
- A reading that is floating above 95% means that indices trading bulls are in control and there is buying of indices. A trader should wait for the Stochastic indicator to move below 95% as a sign that the buying pressure is easing.
- The sell stock signal gets to be confirmed when the stochastic indicator goes below overbought, then after a while returns to over-bought but this time moves down immediately without staying at the over-bought.
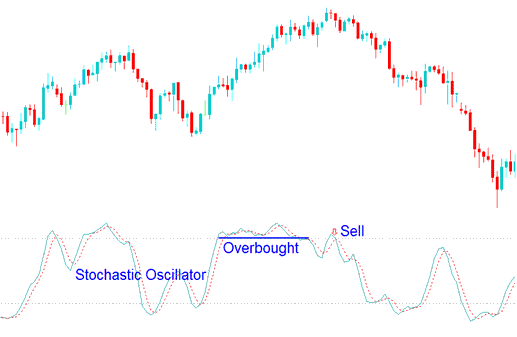
Sell Trading Signal Using Stochastic Indicator Over-bought Levels
When analyzing various chart time frames, utilizing oversold and overbought levels can assist in identifying the appropriate entry strategy for initiating a trade.
Stick to the market's main flow in trades. Check short signals against long-term stochastics for sure bets.
Learn More Tutorials & Courses:
- How to Place EU 50 in MetaTrader 4 iPad App
- Three Steps To Help Improve Your Index Trade Results
- How is DAX30 Index Traded on the MT5 Platform?
- Index Trade Indicators List & Their Analysis
- MACD Bullish Divergence vs MACD Bearish Trade Divergence
- Study How to Trade DAX Index Guide Tutorial
- Brokers That Provide S&P 500 Stock Index
- How Can I Draw Index Trend-Lines Bounce Analysis?
- Top 100 MT4 Stock Index Brokers Providing Demo Practice Account
- How Do You Analyze Stock Index Day Trading Strategies?
