Triple Exponential Moving Average (TEMA) Technical Analysis & TEMA Trading Signals
Developed by Patrick Mulloy.
This stock indicator was originally used for trading analysis in the Stock exchange and Commodities stock market before being used in stock technical analysis.
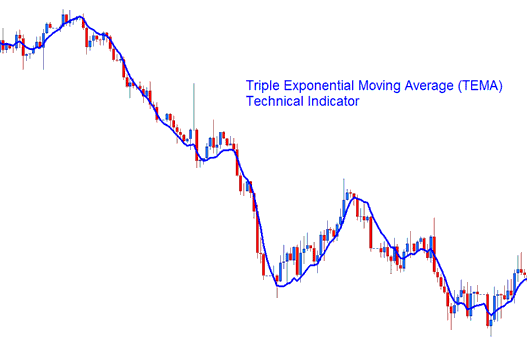
This is a market tool to follow trends, made to make up for the slowness of the initial exponential moving average.
The calculation is based on 3 EMAs:
- a single EMA
- a double EMA and
- a triple EMA
The 3 EMAs when combined produce a lesser amount of lag than any of the 3 EMAs.
Technical Analysis and Generating Signals
The TEMA can be traded and transacted in the same way as the original and initial Moving Averages
The most popular technical analysis technique of generating signals is to compare the moving average line and the stock trading price action.
- A buy signal is generated when both the stock price & the indicator are moving upwards while
- A sell stock signal is generated/derived when the stock price & the indicator are both moving downwards.
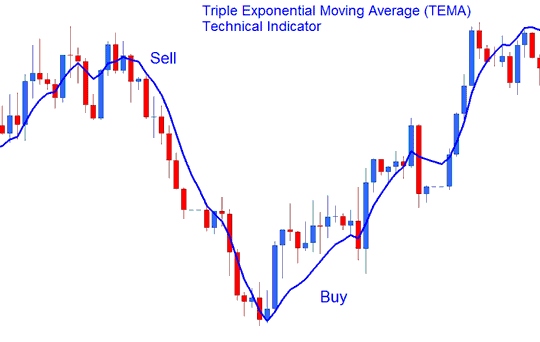
Buy Sell Signal
Indices Cross Over System
The crossover method is another widely used technique in technical analysis known as TEMA.
The TEMA cross-over system includes two or more triple exponential moving averages crossing above/below each other to generate signals. One indicator has got fewer periods than the other. This strategy also will include combining it with other indicators as an additional entry confirmation trading signal
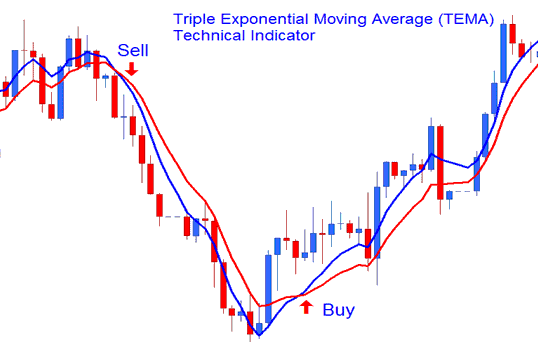
Indices Cross Over System
Get More Tutorials & Courses:
- Grid, Volumes, AutoScroll and MT4 Chart Shift in MT4 Software Platform
- What is Margin Requirement per 1 Lot of WallStreet30 Index?
- Learn How to Trade SMI Index Training Tutorial
- How to Add Force Index Indicator in Chart in MetaTrader 4 Software Platform
- Metaquotes MT5 indices trading candles Charts
- NETH 25 Stock Index Trading Trade Strategy How to Develop Indices Strategy for NETH25 Tutorial Course
