Triple Exponential Average Technical Analysis & TRIX Trading Signals
Developed & Created by Jack Hutson
The TRIX indicator is a triple smoothed oscillator designed to eliminate spikes that can lead to false signals in calculations. These spikes or market cycles that are shorter than the selected indicator period used for calculations and drawings are disregarded.
Triple Exponential Average is an oscillator indicator which oscillates above & below a center-line mark. The centerline level is used to determine bullish and bearish trends. TRIX will measure the momentum of an up-trend or downtrend. Above the center-line shows bullish trends and below the centerline illustrates bearish trends
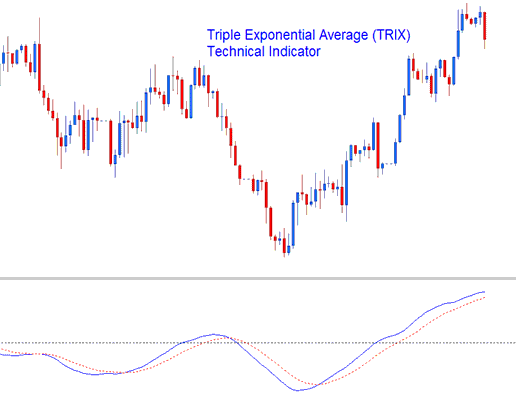
Technical Analysis & How to Generate Signals
Bullish Buy Signal
A buy signal can be derived and generated using 2 techniques and methods:
- The first one is the center line crossover signal where values above the line are bullish.
- The second one is used to generate a trade signal when the signal line crosses above TRIX line.
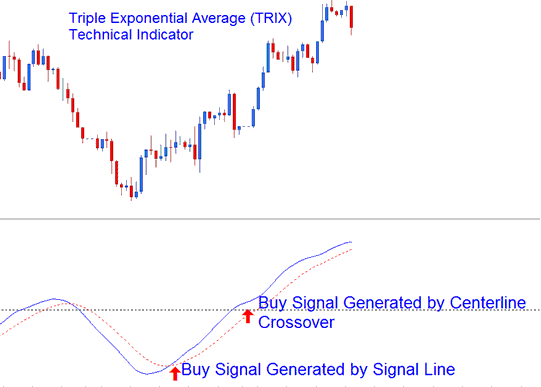
Bullish Buy Signal
Bearish Sell Trade Signal
A sell signal can be generated using 2 techniques and methods:
- The first one is the center line cross over signal where values below the line are bearish.
- The second one is used to generate a trade signal when the signal line crosses below TRIX line.
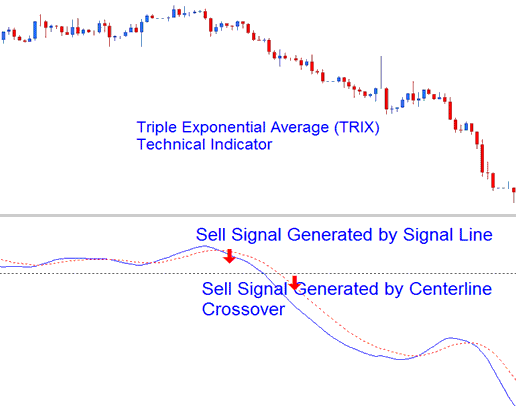
Bearish Sell Signal
Divergence Trading
Divergence can be used to generate signals. Traders can look for divergence between price and the indicator & make a decision which direction to trade.
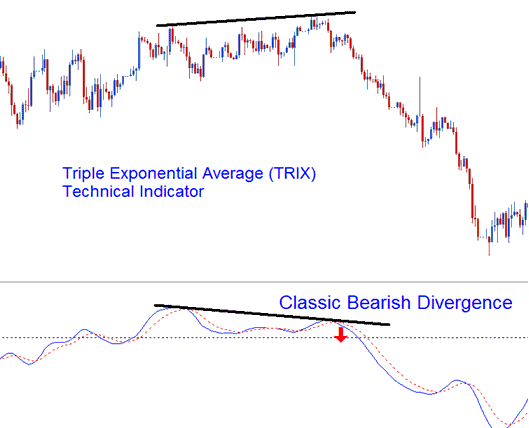
Divergence Trade
Learn More Topics and Courses:
- Which Broker Can Use for Stock Index S&P ASX200?
- How is FTSEMIB40 Traded on the MetaTrader 5 Trade Platform?
- EU50 Pips Value
- Best SPAIN35 Strategy
- How to Place US100 on MT5 Android App
- What's SWI 20 Trading Strategy?
