TSI Indices Technical Analysis & TSI Trade Signals
Index Trend Strength Indicator
Developed & Created by William Blau
TSI is a momentum indicator for trading. It uses a quick momentum formula. This makes it react fast to price shifts and lead the market direction.
The TSI shows as a blue line. A red signal line joins it. Crosses between them create signals.
The TSI also makes a histogram that shows how different the TSI Line and the Signal-line are. This histogram goes above or below the middle line: histogram levels above the middle line show a positive crossover signal, while levels below the middle line show a negative crossover signal.
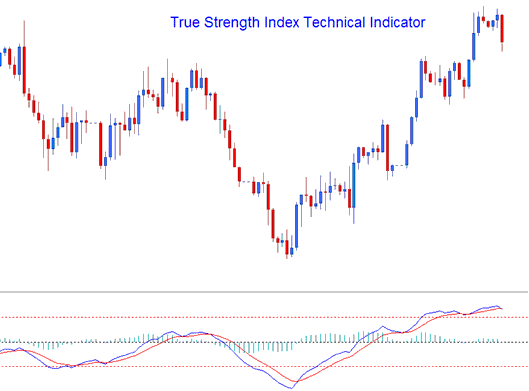
Index Technical Analysis & How to Generate Signals
The TSI technical indicator utilizes a variety of distinct methodologies and techniques to generate signals for trade entry. This indicator can be employed similarly to the RSI for ascertaining the general direction of market trends. Furthermore, overbought and oversold conditions can also be visualized using the TSI. The most conventional approaches for signal generation are:
Zero line Crossover ( Histogram crossover not Lines Stock Index crossover)
- Buy - when the histo-gram crosses above 0 a buy gets generated
- Sell - when the histogram crosses below the 0 a sell is generated
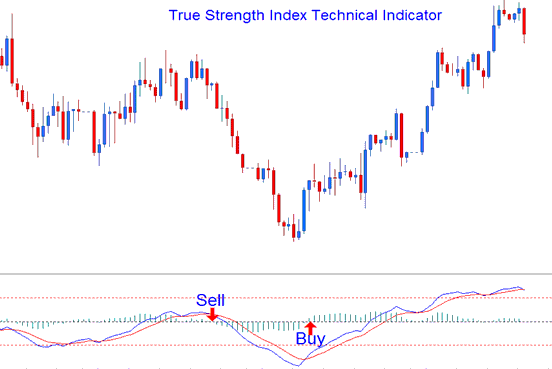
Stock Signal line Crossover
- A buy signal gets derived & generated when the TSI line crosses above the Signal Line
- A sell gets generated when TSI line crosses below the Signal Line
This signal mirrors the one mentioned above, with the timing aligning with the moments when the histogram crossovers occur.
Divergence Trading
Divergence is used to find possible spots where the indices trend might change. Here are the change patterns:
Classic Indices Divergence
Stock Index Classic Bullish Divergence: Lower lows in price and higher lows on the trading indicator
Index Classic Bearish Divergence: Higher highs in price and lower highs on the indicator
Divergence analysis can also reveal forthcoming points where the price action direction might continue its trend. The types of continuation divergence trade setups include:
Hidden Stock Divergence Trading Setup
Stock Index Hidden Bullish Divergence: higher lows in price and lower lows in the indicator
Index Hidden Bearish Divergence: lower highs in price and higher highs on the indicator
Over-bought/Oversold Levels in Indicator
This can be used to identify overbought and oversold conditions in price action movements.
- Over-bought condition - levels being greater than the +25 level
- Oversold condition - levels being lesser than the -25 level
Trades can be generated when TSI crosses these technical levels.
A buy signal is generated when the indicator levels cross above the -25 level.
Sell signal - when the areas cross below +25 level a sell signal is generated.
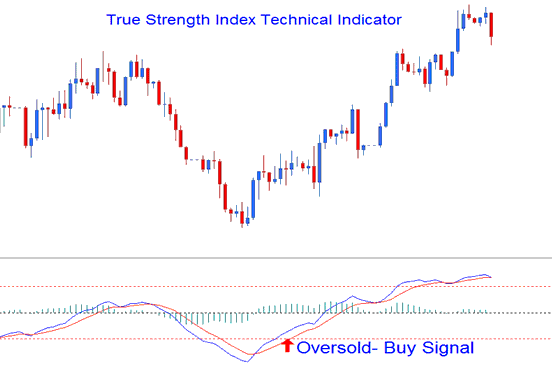
Oversold - Buy Signal
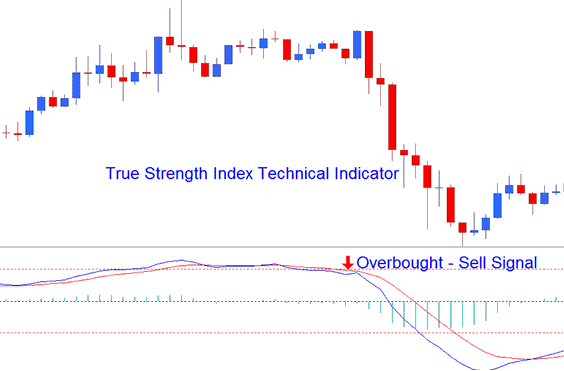
Over-bought - Sell Trade Signal
Overbought and oversold levels are marked using horizontal lines positioned at the +25 and -25 points.
Study More Topics & Lessons:
- Indicators List on Charts Menu in MetaTrader 4 Trading Platform
- MetaTrader 4 Meta-Editor: How to Place Index EA EAs
- Study Indices Basics & Indices Market Basic Concepts
- MetaTrader 4 Index Platform/Software Training Tutorial for Beginner Traders iPhone Trade App
- How to Get AS 51 Index in MetaTrader 4 App
