Dark Cloud Cover Bearish Stock Candlesticks Pattern
Dark Cloud Cover Stocks Candlestick Pattern
Dark Cloud Cover Stocks Candle Pattern is the opposite of piercing candle pattern.
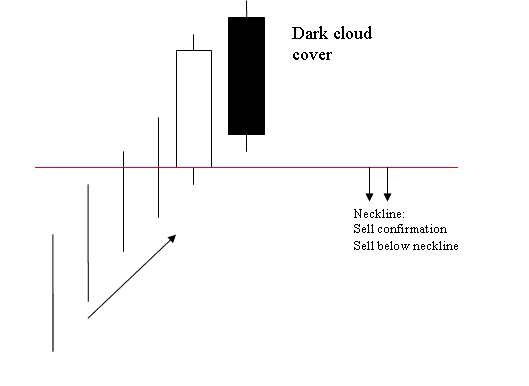
Dark cloud cover candlestick pattern is a long white body followed by a long black body.
Black body pierces the midpoint of the prior white body.
Dark cloud cover candlestick pattern is a bearish reversal candlestick pattern that forms at the top of a stock upward stocks trend.
Dark cloud cover candlestick pattern shows that the stocks market opens higher and closes below the midpoint of the white body.
Dark cloud cover candlestick pattern shows that the momentum of the up stock trend is reducing & the stocks market trend is likely to reverse and move in a downwards direction.
Dark cloud cover candlestick pattern is shown known as a cloud cover - signifying the cloud as a ceiling for the stock price upwards trend.
Dark Cloud Cover Stocks Candle Pattern - How to Trade Dark Cloud Cover Stock Candles Patterns Technical Analysis PDF - How to Analyze Dark Cloud Cover Stock Candles Pattern
Technical Analysis Dark Cloud Cover Stocks Candle Pattern
A sell stock signal is confirmed once stocks price closes below the neck-line which is the opening of the candlestick on the left of this Dark cloud cover candle pattern.
This is a bearish candlestick pattern setup and stocks price should continue moving downwards and for a trader who puts a sell stock trade should also put stop loss stock orders just above the highest stock price area.


