Hanging Man Bearish Stocks Candlesticks Pattern
Hanging Man Stocks Candlestick Pattern
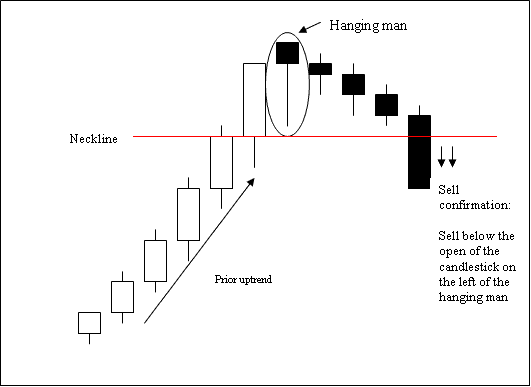
Hanging Man Stocks Candles Pattern is a potentially bearish reversal stock signal which occurs during a stock upward trend. Hanging Man Stocks Candle Pattern is named so because it resembles a man hanging on a noose up high.
A hanging man candlestick pattern has:
- A small body
- The body is at the top
- The lower shadow is 2 or 3 times length of real body.
- Has no upper shadow or very small upper shadow if present.
- The color of the body isn't important
Hanging Man Stocks Candle Pattern - How to Trade Hanging Man Stock Candles Patterns Technical Analysis PDF - How to Analyze Hanging Man Stock Candles Pattern
Technical Analysis of Hanging Man Stock Candlesticks Patterns
The sell stock signal is confirmed when a bearish stock candlestick closes below the open of the candlestick on the left side of this hanging man candle pattern.
Stop Loss orders should be set a few pips just above the high of the hanging man candle pattern.


