Is Double Tops Pattern Bullish or Bearish?
Double Top Stocks Trading Pattern
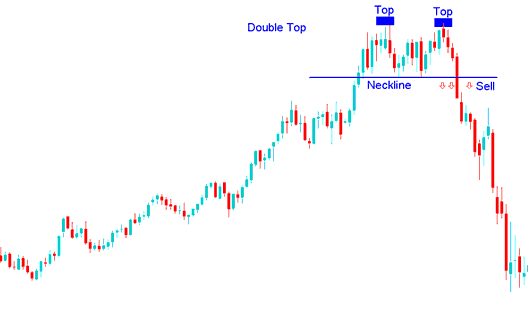
Double Tops Stock Chart Pattern is a Bearish Stocks Chart Pattern - Double Tops Pattern is a Bearish Stock Trading Signal Pattern
Summary:
- Double tops stocks chart pattern forms after an extended move upwards- upwards stock trend
- Double tops stocks chart pattern signal indicates that there will be a reversal in stocks market trend
- We sell when stocks price breaks-out below neck-line: as explained on the stocks examples illustrated & described below.
Stock Trade a Double Top Stock Chart Pattern?
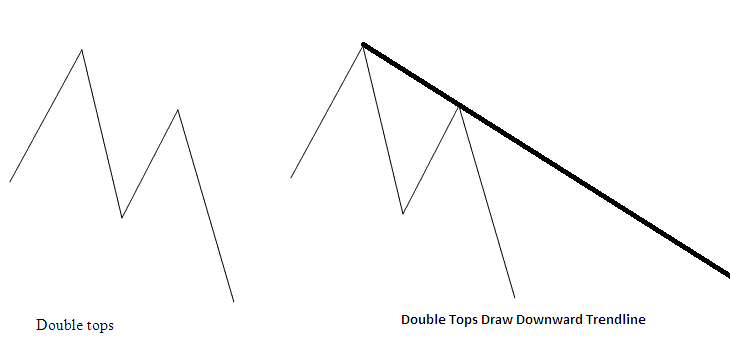
Double tops stocks pattern look like an M Shape pattern, the best reversal stock signal from the double top stock trading chart pattern is where the second top is lower than the first top as displayed below:
This means that the reversal stock signal can be confirmed by drawing a downwards stock trend line as shown below. If a trader opens a sell stock trade using this double tops reversal stock signal the stop loss will be placed just above this downward stock trend line.
Technical Analysis of Double Tops Stocks Chart Pattern - Example of Double Tops Stock Chart Pattern


