Reversal Stock Candlesticks Patterns
Hammer Bullish Stocks Candlesticks Patterns
Reversal stocks candles patterns occur after an extended prior trend. Therefore, for a stocks candles pattern to qualify as a reversal stock candles pattern there must be a prior trend.
These reversal stock candlesticks patterns are:
- Hammer Stocks Candles Pattern & Hanging Man Stock Candlesticks Pattern
- Inverted Hammer Stocks Candles Pattern and Shooting Star Stock Candlesticks Pattern
- Piercing Line Stocks Candles Pattern and Dark Cloud Cover Stock Candlesticks Pattern
- Morning Star Stock Candlesticks & Evening Star Stock Trading Candles
- Engulfing Stock Candles Patterns
Hammer Stocks Candles Pattern and Hanging Man Stocks Candles Pattern Stocks Trading Candlesticks
Hammer Stocks Candles Pattern & Hanging Man Stock Candlesticks Pattern stock trading candlesticks look alike but hammer is bullish reversal stocks candlesticks pattern and hanging man is a bearish reversal stocks candlesticks pattern.
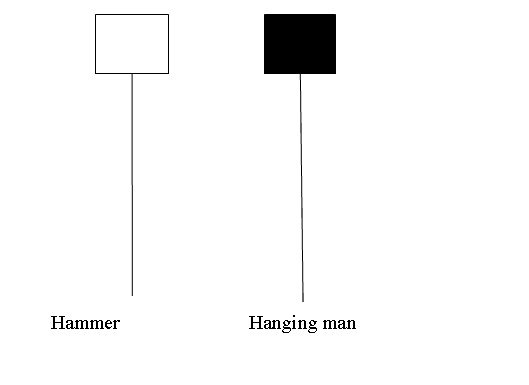
Hammer Stocks Candles Pattern & Hanging Man Stock Candlesticks Pattern Stock Trading Candlesticks
Hammer Stocks Candles Patterns
Hammer is a potentially bullish pattern that forms during a stock downwards trend. It is named so because the stocks market is hammering out a market bottom.
A hammer has:
- A small body
- The body is at the top
- The lower shadow is 2 or 3 times the length of real body.
- Has no upper shadow or very small upper shadow if present.
- The color of the body is not important
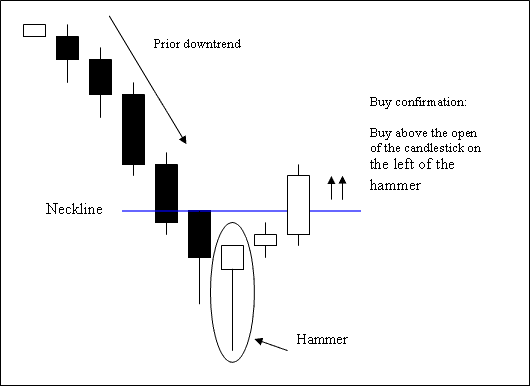
Hammer Stock Trading Candlesticks
Stock Trading Analysis of Hammer Stock Candlesticks Patterns
The buy stock signal is confirmed when a stock candlesticks closes above the opening stocks price of the stock candles on the left side of the hammer stock trading candlesticks pattern.
Stop orders should be place a few pips just below the low of the hammer stocks candle.
Inverted Hammer Bullish Stocks Candles Patterns
Inverted Hammer Stocks Candles Pattern and Shooting Star Stocks Candlesticks Pattern stock candlesticks look alike. These have a long upper shadow and a short body at the bottom. Their color does not matter. What matters is the point where they appear whether at the top of a stocks market trend (star) or the bottom of a stocks market trend (hammer).
The difference is that inverted hammer is a bullish reversal stocks candlesticks pattern while shooting star is a bearish reversal stock candle-sticks pattern.
Upward Stock Trading Trend Reversal - Shooting Star Stock Trading Candles
Downward Stock Trading Trend Reversal - Inverted Hammer Stock Trading Candles
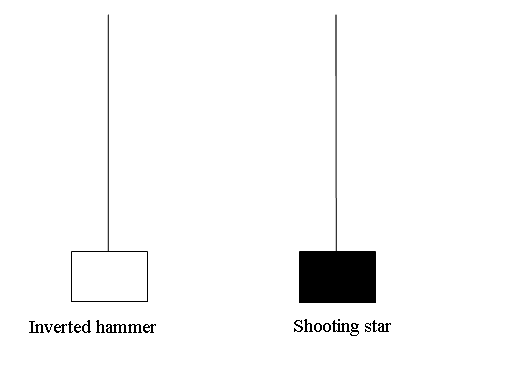
Inverted Hammer Stocks Candles Pattern and Shooting Star Stock Candlesticks Pattern Stock Candles Patterns
Inverted Hammer Stocks Trading Candle
This is a bullish reversal stocks candles pattern. It forms at the bottom of a Stock trend.
Inverted hammer occurs at the bottom of a downward stock trend & indicates the possibility of reversal of the downward stocks trend.
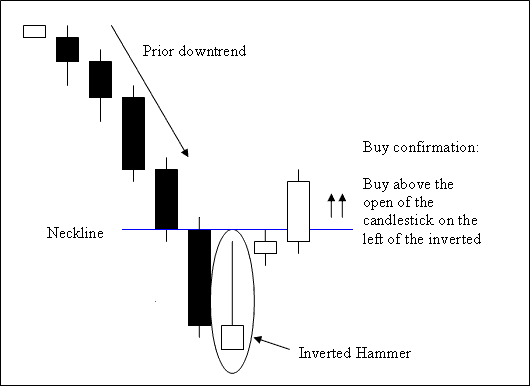
Inverted Hammer Stock Candle
Stock Trading Analysis of Inverted Hammer Stock Candle
A buy is confirmed when a stock candlesticks closes above the neckline, this is the opening of the stock candlesticks on the left side of this pattern. The neck-line in this instance is a resistance area.
Stop orders for the buy stocks trades should be set few pips below the lowest stocks price on the recent low.
An inverted hammer is named so because it signifies that the stocks market is hammering out a bottoms.


