Parabolic SAR Forex Technical Analysis & Parabolic SAR - Trailing Stop Loss MT4 Indicator
Developed by J. Welles Wilder & is used to set trailing price stops. This Trailing StopLoss Indicator was originally developed to analyze trending Forex Markets. It is drawn as a forex chart overlay indicator, that's on the forex price chart itself.
This is a very accurate indicator for providing exit points & thus it is used to set trailing stops & is usually referred to as the 'SAR' (stop-and-reversal) - Trailing Stop Loss MT4 Indicator.
This Trailing Stop Loss MT4 Indicator is drawn above or below the price - it is drawn as a series of dots. The length of movement of the SAR will be determined by the scale of the forex price movement.
In an upward Forex trend the parabolic SAR will be below the price. As long as the uptrend continues then the SAR will continue being below the price - Trailing Stop Loss Indicator. When price move down and the parabolic SAR goes above the price then the Forex trend reverses to bearish.
This trailing stop loss indicator uses a parabolic calculation to plot the series of dots, This means that if the forex price stops moving upwards with the same acceleration, the parabolic will continue with the same acceleration thus at some point the price will hit the technical indicator if it slows down too much.
Explanation
This Trailing Stop Loss MT4 Indicator provides excellent exit points. You should close long positions when the price falls below SAR and close short positions when the price rises above it.
If you are long, the Parabolic SAR - Trailing Stop Loss MT4 Indicator will move up every day, regardless of the direction the currency price is moving. The amount this indicator moves up depends on the amount that forex prices move.
The same technical analysis will also apply to a downward forex trend, the parabolic SAR - Trailing Stop Loss MT4 Indicator will be above the forex price and it should remain above the price until the bearish downtrend reverses.
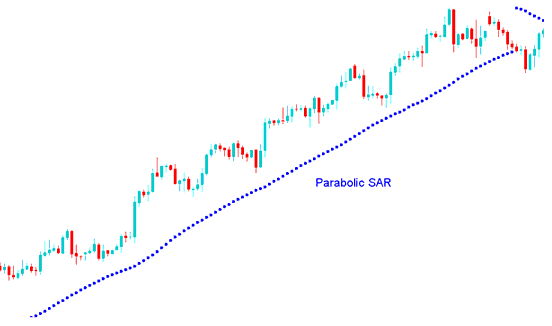
The forex chart below shows an example of the Parabolic SAR in an uptrend forex market, You can see how it trailed below the forex price (Bullish Forex Market) until when it was hit and the Forex trend reversed.